1. In figure the value of the median of the data using the graph of less than ogive and more than ogive is
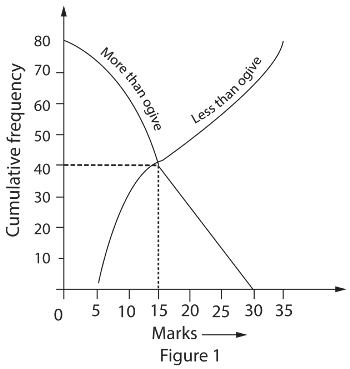
(a) 5 (b) 40 (c) 80 (d) 15
2. Write the empirical relationship among the three measures of central tendency.
3. What represents the abscissa of the point of intersection of more than type and of the more than cumulative frequency of curves of a grouped data?
4. A data has 35 observations arranged in ascending order. Find the observation which represents the median.
5. Which measures of central tendency can’t be found graphically?
6. If mean = 20 , median = 30 find mode.
7. If Mean = 20, mode = 29 find median.
8. If mode = 40 and mean = 130 find median .
9. If mode = 12, mean = 120 find median .
10. If mean = 20, median = 28 find mode.
11. Find the empirical relationship between the three measures of central tendencies.
12. The relation connecting the measures of central tendencies is :
(a) mode = 2 median – 3 mean
(b) mode = 3 median – 2 mean
(c) mode = 2 median + 3 mean
(d) mode = 3 median + 2 mean
13. If the variance of a data is 12.25, then the standard deviation is
(a) 3.5 (b) 3 (c) 2.5 (d) 3.25
14. For any collection of n items, ![]()

15. What is the mean of 1st n natural numbers ?
16. The mean of 9 observations is 60. If the mean of 1st 5 observation is 50 and that of last of 5 observations 45. Find the 6th observation.
17. What is the average of 1st ten prime numbers ?
18. What is the point of intersection of abscissa of more than type and less than type cumulative frequency called?
19. Consider the following frequency distribution of the height of 60 students of a class.
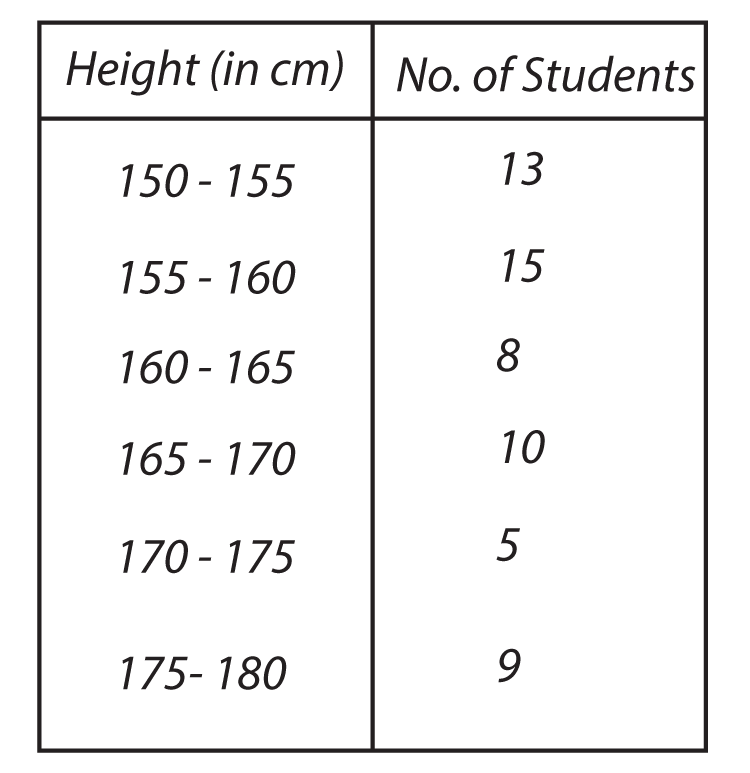
Find the sum of lower limit & upper limits of modal class
20. What is mode of a data if mean is 32 and median is 24.
Latest Govt Job & Exam Updates: