Question 1:
The following table shows the ages of the patients admitted in a hospital during a year:

Find the mode and the mean of the data given above. Compare and interpret the two measures of central tendency.
Answer:
To find the class marks (xi), the following relation is used.

Taking 30 as assumed mean (a), di and fidi are calculated as follows.

From the table, we obtain

Mean of this data is 35.38. It represents that on an average, the age of a patient admitted to hospital was 35.38 years.
It can be observed that the maximum class frequency is 23 belonging to class interval 35 − 45.
Modal class = 35 − 45
Lower limit (l) of modal class = 35
Frequency (f1) of modal class = 23
Class size (h) = 10
Frequency (f0) of class preceding the modal class = 21
Frequency (f2) of class succeeding the modal class = 14
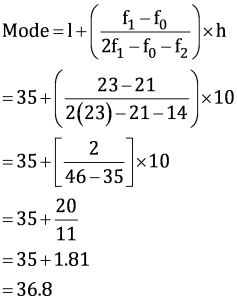
Mode is 36.8. It represents that the age of maximum number of patients admitted in hospital was 36.8 years.
Latest Govt Job & Exam Updates: