Question 1:
The following frequency distribution gives the monthly consumption of electricity of 68 consumers of a locality. Find the median, mean and mode of the data and compare them.

Answer:
To find the class marks, the following relation is used.

Taking 135 as assumed mean (a), di, ui, fiui are calculated according to step deviation method as follows.

From the table, we obtain

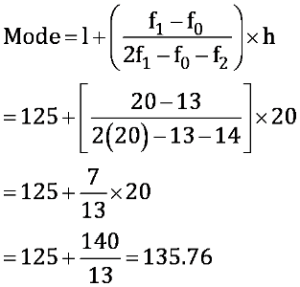
From the table, it can be observed that the maximum class frequency is 20, belonging to class interval 125 − 145.
Modal class = 125 − 145
Lower limit (l) of modal class = 125
Class size (h) = 20
Frequency (f1) of modal class = 20
Frequency (f0) of class preceding modal class = 13
Frequency (f2) of class succeeding the modal class = 14
To find the median of the given data, cumulative frequency is calculated as follows.

From the table, we obtain
n = 68
Cumulative frequency (cf) just greater than  is 42, belonging to interval 125 − 145.
Therefore, median class = 125 − 145
Lower limit (l) of median class = 125
Class size (h) = 20
Frequency (f) of median class = 20
Cumulative frequency (cf) of class preceding median class = 22

Therefore, median, mode, mean of the given data is 137, 135.76, and 137.05 respectively.
The three measures are approximately the same in this case.
Latest Govt Job & Exam Updates: