Question 4:
The following distribution gives the state-wise teacher-student ratio in higher secondary schools of India. Find the mode and mean of this data. Interpret the two measures.

Answer:
It can be observed from the given data that the maximum class frequency is 10 belonging to class interval 30 − 35.
Therefore, modal class = 30 − 35
Class size (h) = 5
Lower limit (l) of modal class = 30
Frequency (f1) of modal class = 10
Frequency (f0) of class preceding modal class = 9
Frequency (f2) of class succeeding modal class = 3

It represents that most of the states/U.T have a teacher-student ratio as 30.6.
To find the class marks, the following relation is used.

Taking 32.5 as assumed mean (a), di, ui, and fiui are calculated as follows.

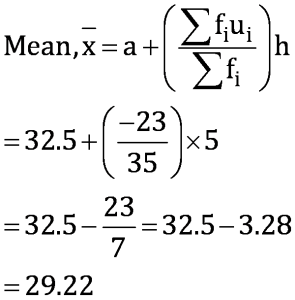
Therefore, mean of the data is 29.2.
It represents that on an average, teacher−student ratio was 29.2.
Latest Govt Job & Exam Updates: