Pie-Charts
Directions (Q. Nos. 1 to 5) Study the following graph carefully to answer these questions.
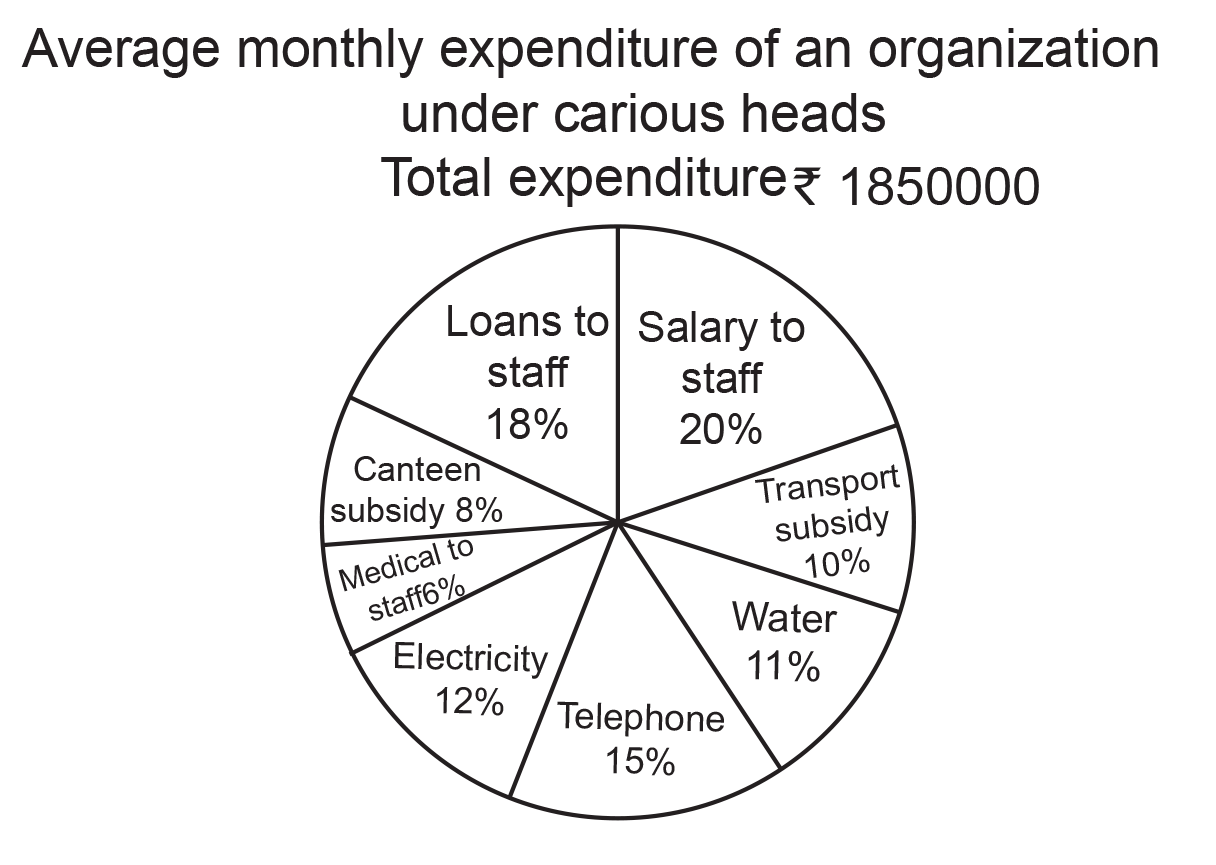
1. What is the amount spent on transport subsidy and canteen subsidy together?
(1) Rs 334000
(2) Rs 343000
(3) Rs 330000
(4) Rs 333000
(5) None of these
2. What is the difference between the expenditure on salary to staff and that on loans to staff ?
(1) Rs 37200
(2) Rs 35700
(3) Rs 37500
(4) Rs 35000
(5) None of these
3. The amount spent on medical to staff is what per cent of the amount spent on salary?
(1) 30%
(2) 33%
(3) 25%
(4) 22%
(5) None of these
4. What is the amount spent on telephone ?
(1) Rs 275500
(2) Rs 270500
(3) Rs 277500
(4) Rs 277000
(5) None of these
5. What is the expenditure on electricity and water together?
(1) Rs 425000
(2) Rs 425500
(3) Rs 422500
(4) Rs 425800
(5) None of these
Directions (Q. Nos. 6 to 10) Study the pie-chart carefully to answer the questions that follow.
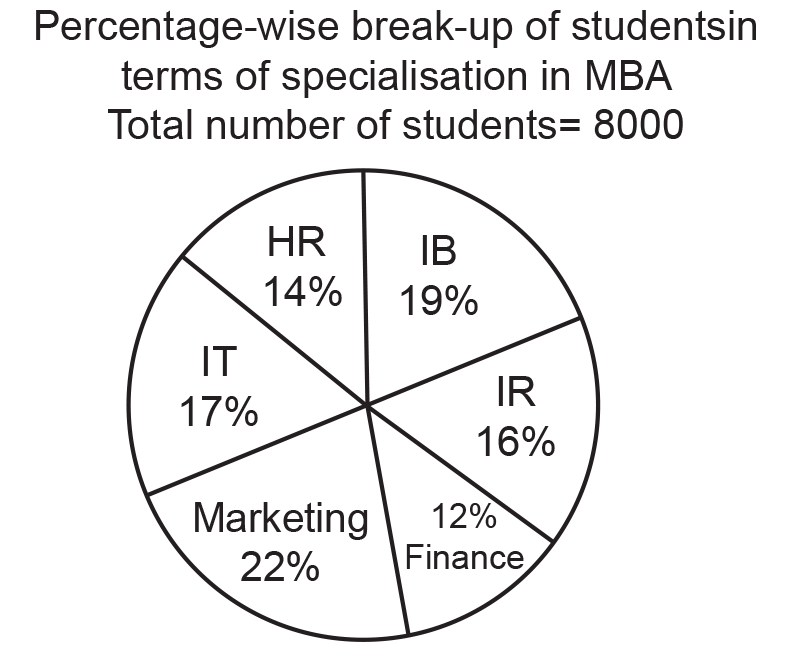
6. What is the total number of students having specialization in IR, Marketing and IT?
(1) 4640
(2) 4080
(3) 4260
(4) 4400
(5) None of these
7. Students having IB as specializations forms approximately what per cent of students having Marketing as specialization?
(1) 116
(2) 86
(3) 124
(4) 74
(5) 66
8. What is the total number of students having IB as specialization?
(1) 1520
(2) 1280
(3) 1360
(4) 1120
(5) None of these
9. What is the ratio of the students having Finance as specialization to students having HR as specialization?
(1) 11 : 19
(2) 18 : 13
(3) 6 : 7
(4) 12 : 21
(5) None of these
10. Students having IR as specialization forms approximately what per cent of students having HR as specialization?
(1) 87
(2) 106
(3) 76
(4) 62
(5) 114
Directions (Q. Nos. 11 to 15) Study the pie-charts carefully to answer the questions that follow.
Percentage distribution of candidates studying in various disciplines of a college and the percentage of girls in each discipline.
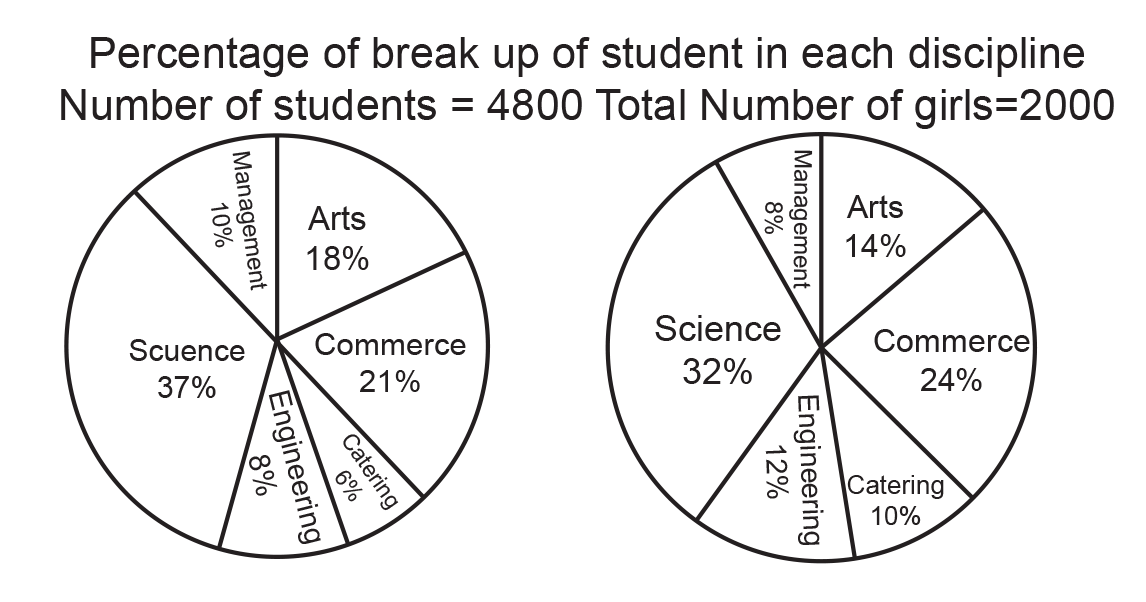
11. What is the number of girls studying in Engineering discipline?
(1) 180
(2) 220
(3) 320
(4) 260
(5) None of these
12. Which discipline has the highest number of boys studying in it?
(1) Science
(2) Commerce
(3) Arts
(4) Management
(5) None of these
13. The number of boys studying in Commerce discipline forms approximately what per cent of the total number of students studying in that discipline?
(1) 40
(2) 52
(3) 36
(4) 28
(5) 68
14. What is the respective ratio of number of boys studying in Management discipline to the boys studying in Science discipline?
(1) 71 : 20
(2) 18 : 67
(3) 20 : 71
(4) 67 : 18
(5) None of these
15. The number of girls studying in Catering discipline forms what per cent of the total number of students in the college? (rounded off to two digits after decimal)
(1) 3.28
(2) 5.61
(3) 3.95
(4) 4.17
(5) None of these
Direction (Q. Nos. 16 to 20) Study the following pie-chart carefully to answer the questions that follow.
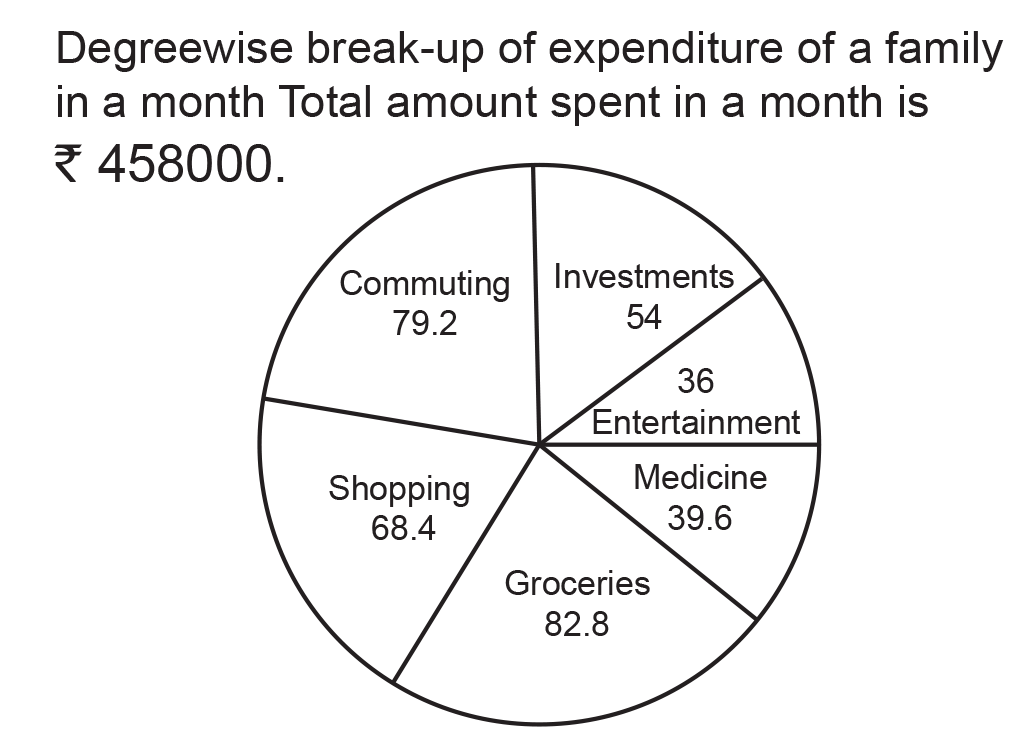
16. What is the amount spent by the family o n Commuting?
(1) Rs 10076
(2) Rs 10534
(3) Rs 6870
(4) Rs 8702
(5) None of these
17. What is the ratio of the amount spent by the family on Medicine to the amount spent on Groceries ?
(1) 1 : 2
(2) 13 : 21
(3) 3 : 5
(4) 11 : 23
(5) None of these
18. What is the total amount spent by the family on Entertainment and Shopping together?
(1) Rs 9618
(2) Rs 13282
(3) Rs 13740
(4) Rs 11908
(5) None of these
19. The total amount spent by the family on Groceries, Entertainment and Investments together forms approximately what per cent of the amount spent on Commuting?
(1) 209
(2) 76
(3) 154
(4) 42
(5) 218
20. The amount spent by the family on Medicine forms what per cent of the amount on Shopping? (rounded off to two digits after decimal)
(1) 43.67
(2) 49.52
(3) 57.89
(4) 61.89
(5) None of these
Latest Govt Job & Exam Updates: