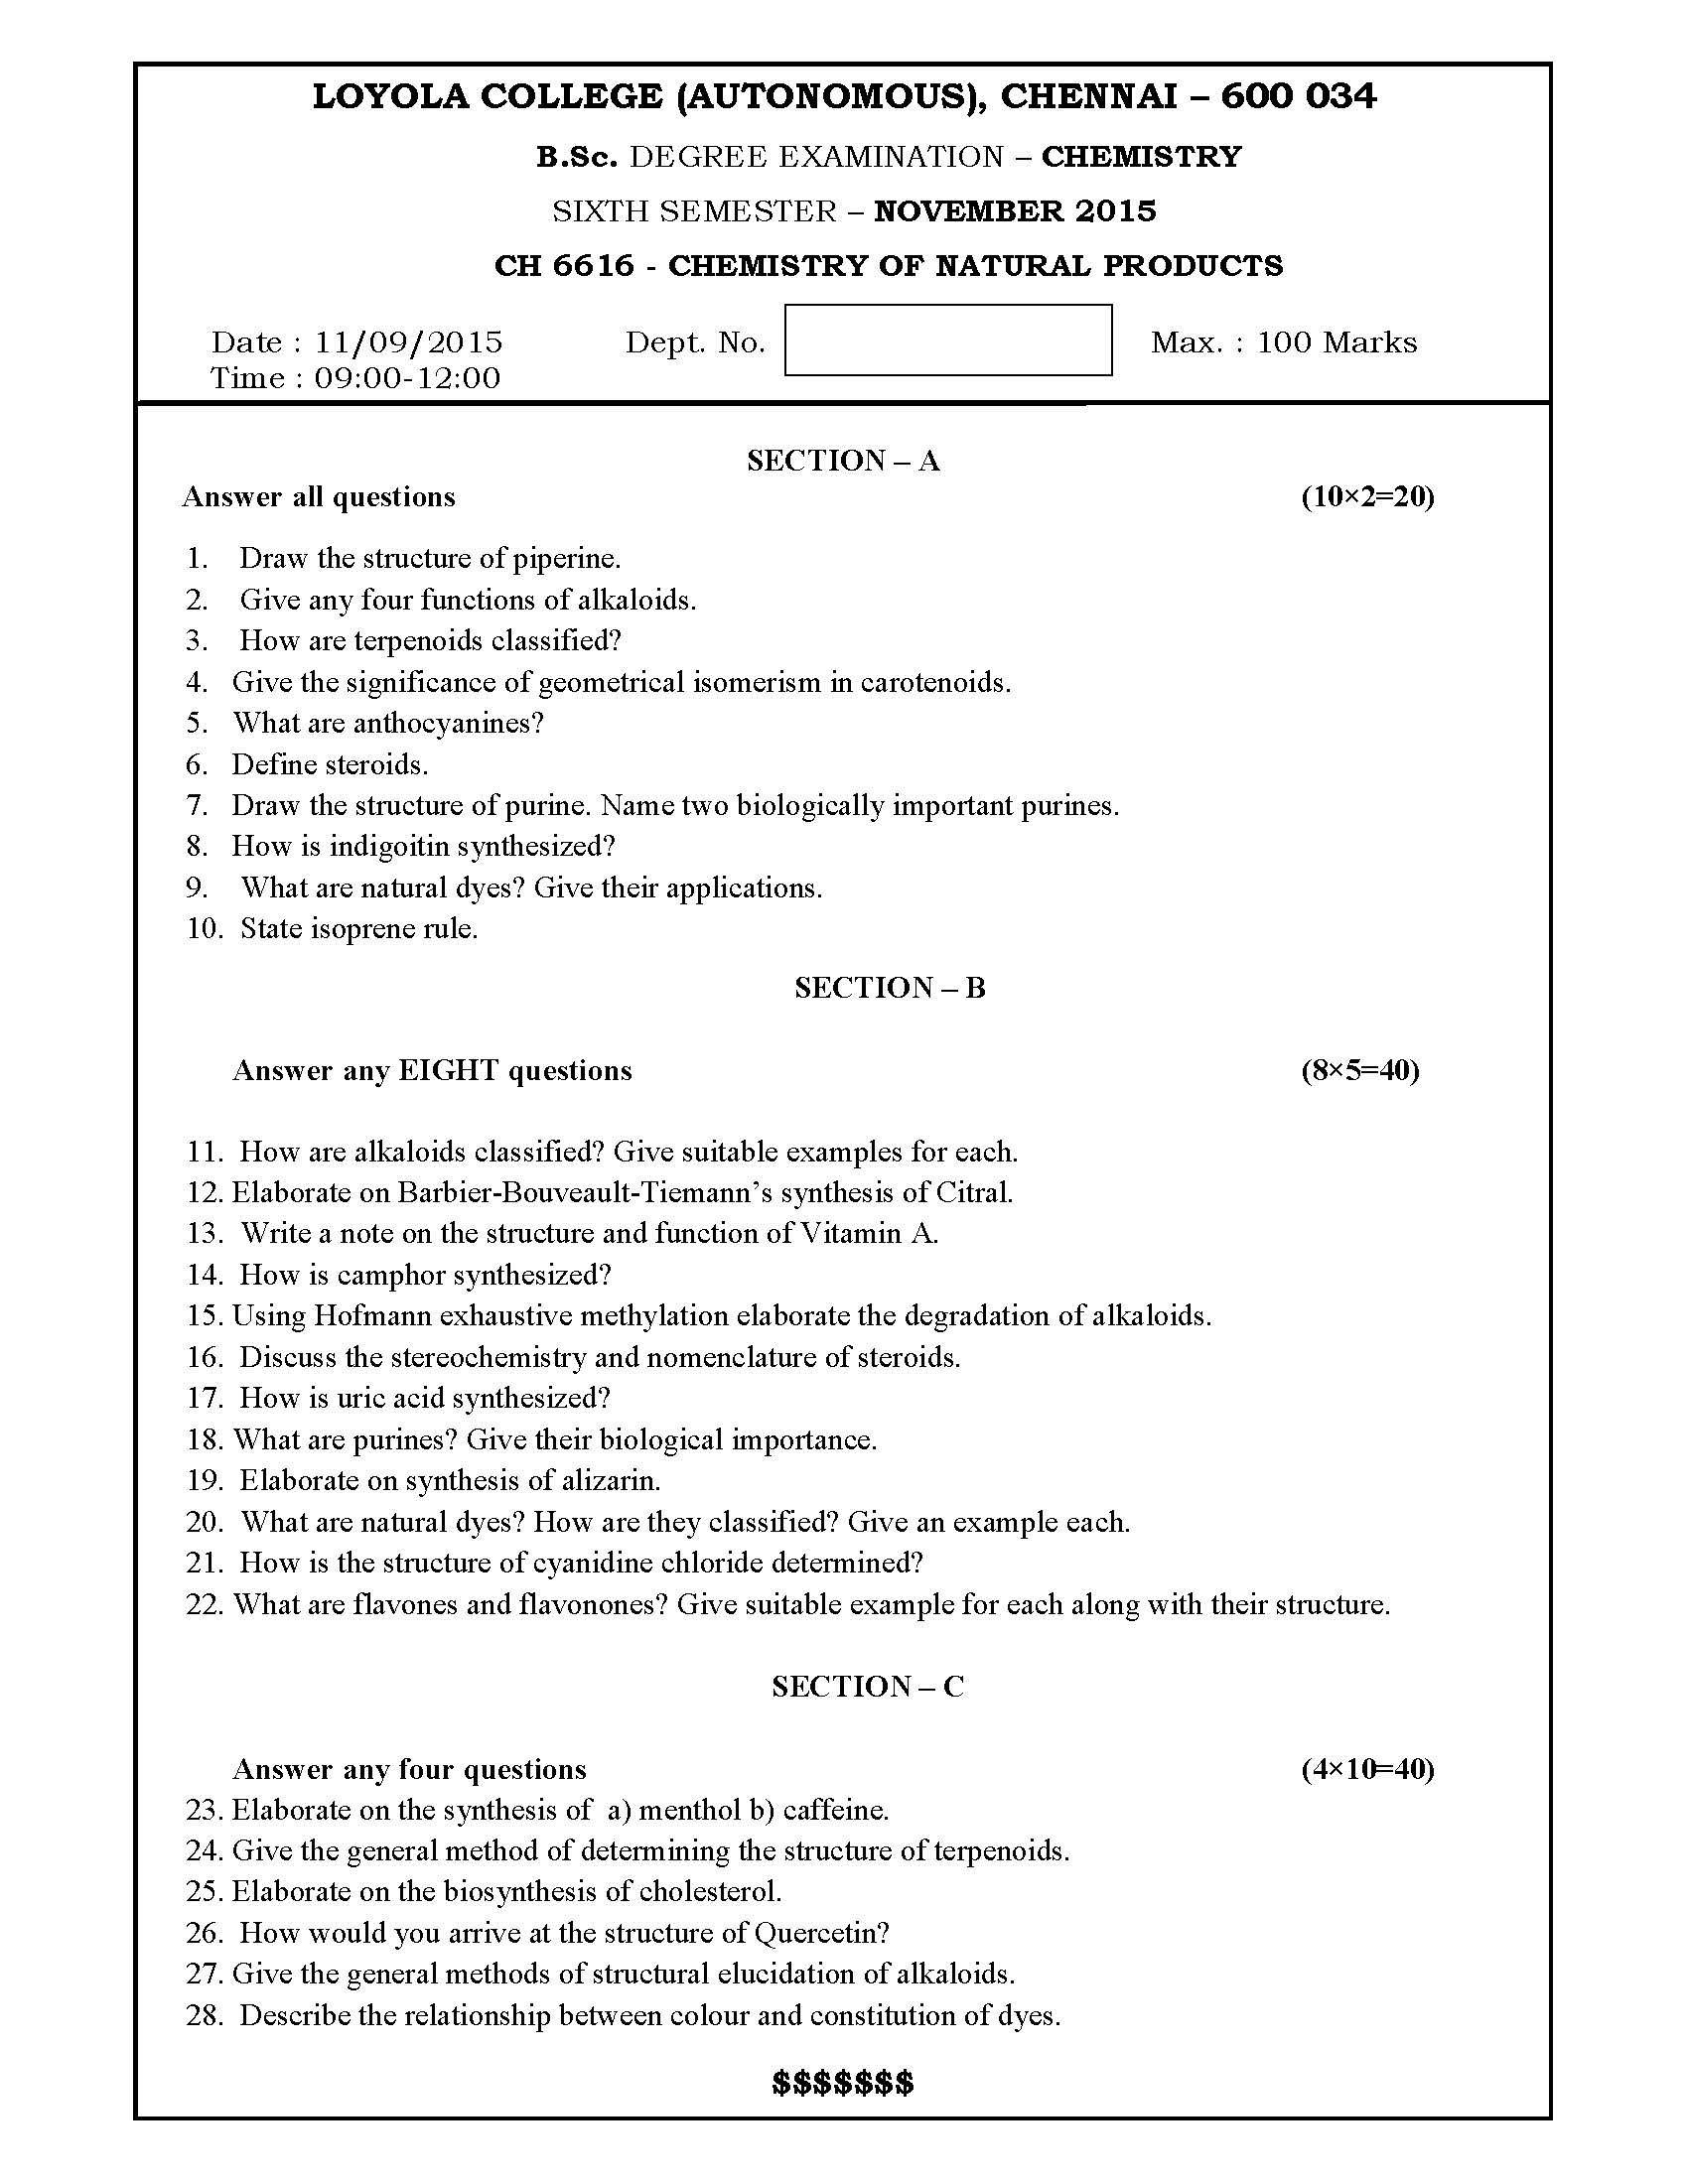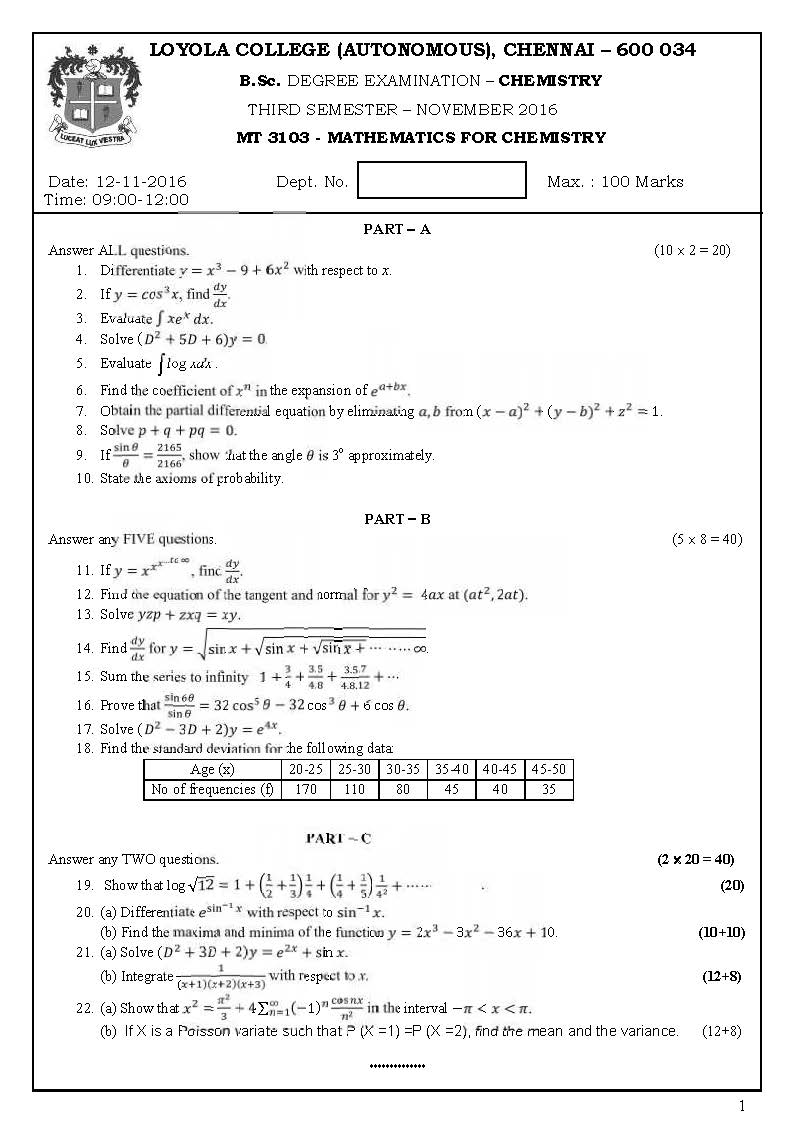
B.Sc. Chemistry Question paper
Loyola College B.Sc. Commerce Nov 2012 Business Statistics Question Paper PDF Download
LOYOLA COLLEGE (AUTONOMOUS), CHENNAI – 600 034
B.Sc. DEGREE EXAMINATION – COMMERCE
THIRD SEMESTER – NOVEMBER 2012
ST 3104/3101 – BUSINESS STATISTICS
Date : 07/11/2012 Dept. No. Max. : 100 Marks
Time : 9:00 – 12:00
SECTION – A
Answer All the Questions: ( 10 x 2 =20)
- Define the term Statistics
- How are statistics being mis-used? Give anyone mis-interpretation of statistics.
- Define Weighted Arithmetic Mean.
- Why is median called a positional average?
- State the properties of Pearson’s correlation coefficient.
- What is meant by regression analysis?
- What is the scatter diagram?
- What are the uses of index numbers?
- Define trend and seasonal variation.
- State the components of time series.
SECTION – B
Answer any five questions: ( 5 x 8 =40 )
- Explain the scope and limitation of statistics.
- Draw a histogram and frequency polygon for the following data:
| Class | 0-10 | 10-20 | 20-30 | 30-40 | 40-50 | 50-60 | 60-70 |
| Frequency | 4 | 6 | 7 | 14 | 16 | 14 | 8 |
- Find coefficient of correlation between the costs and sales for the following data:
| Cost | 39 | 65 | 62 | 90 | 82 | 75 | 25 | 98 | 36 | 78 |
| Sales | 47 | 53 | 58 | 86 | 62 | 68 | 60 | 91 | 51 | 84 |
- An analysis of the weekly wages paid to workers in two firms, A and B belonging
to the same industry give the following results.
| Firm A | Firm B | |
| No. of wage earners | 586 | 648 |
| Avg. Weekly wage | Rs. 52.5 | Rs. 47.5 |
| Variance of the distribution of wage | 100 | 121 |
Find the average weekly wage and the standard deviation of the wage of all the workers in two firms, A and B taken together.
- Find the coefficient of skewness from the following data:
| Value | 6 | 12 | 18 | 24 | 30 | 36 | 42 |
| Frequency | 4 | 7 | 9 | 18 | 15 | 10 | 5 |
- Analyse the following frequency distribution by the method of moments, find β2 and interpret your results.
| X | 2 | 3 | 4 | 5 | 6 |
| F | 1 | 3 | 7 | 3 | 1 |
- Calculate Laspeyre’s, Paashe’s, and Fisher’s index numbers for the data given below
| Commodity | Base year | Current year | ||
| Price | Expenditure | Price | Expenditure | |
| A | 5 | 50 | 6 | 72 |
| B | 7 | 84 | 10 | 80 |
| C | 10 | 80 | 12 | 96 |
| D | 4 | 20 | 5 | 30 |
| E | 8 | 56 | 8 | 64 |
- Solve (using graphical method)
Max Z = 3X1 + 4 X2
Subject to the constraints 4X1 + 2X2 80
2X1 + 5X2 180
and X1, X2 0.
SECTION –C
Answer any TWO questions. ( 2 x 20 =40)
- a) From the following data, calculate mean and mode (7)
| Maks | 0 – 10 | 10 – 20 | 20 – 30 | 30 – 40 | 40 – 50 | 50 – 60 |
| No. of students | 10 | 20 | 30 | 50 | 40 | 30 |
- b) From the marks given below obtained by two students taking the same course,
find out who is more consistent. (13)
| A | 58 | 59 | 66 | 65 | 66 | 52 | 75 | 31 | 46 | 48 |
| B | 56 | 87 | 89 | 46 | 93 | 65 | 44 | 54 | 78 | 68 |
- The following table represents aptitude test scores and productivity indices of 10 workers selected at random.
| Aptitude test scores | 60 | 62 | 65 | 70 | 72 | 48 | 53 | 73 | 65 | 82 |
| Productivity indices | 68 | 60 | 62 | 80 | 85 | 40 | 52 | 62 | 60 | 81 |
Calculate two regression equations and estimate the productivity index of a worker
whose test score is 92.
- From the following data, calculate seasonal indices by Ratio to trend method.
| Year | QUARTERLY SALES (Rs. Lakhs) | |||
| I | II | III | IV | |
| A | 8 | 16 | 24 | 32 |
| B | 48 | 36 | 24 | 12 |
| C | 48 | 16 | 32 | 64 |
| D | 72 | 108 | 144 | 36 |
| E | 56 | 28 | 84 | 112 |
- Obtain an initial basic feasible solution to the following transportation problem by
(i) North-west corner rule
(ii) Least cost method
(iii) Vogel’s approximation methods.
| Destination | |||||
| origin | D | E | F | G | Availability |
| A | 11 | 13 | 17 | 14 | 250 |
| B | 16 | 18 | 14 | 10 | 300 |
| C | 21 | 24 | 13 | 10 | 400 |
| Requirement | 200 | 225 | 275 | 250 | |
Loyola College B.Sc. Commerce Nov 2012 Advanced Statistical Methods Question Paper PDF Download
LOYOLA COLLEGE (AUTONOMOUS), CHENNAI – 600 034
B.Sc. DEGREE EXAMINATION – COMMERCE
THIRD SEMESTER – NOVEMBER 2012
ST 3202 – ADVANCED STATISTICAL METHODS
Date : 09/11/2012 Dept. No. Max. : 100 Marks
Time : 9:00 – 12:00
SECTION A
Answer ALL questions: (10 X 2 = 20 marks)
- What is meant by independence of attributes?
- What are the types of probability sampling?
- Define probability and give an example.
- Write Any four properties of normal distribution
- Explain the term standard error.
- State Central Limit Theorem.
- State Type – I and Type – II error.
- Explain the different type of errors in hypothesis testing
- State the assumptions made in analysis of variance.
- Distinguish between np chart and p chart.
SECTION B
Answer any FIVE questions: (5 X 8 = 40 Marks)
- From the following data, prepare a 2X2 table and using Yule’s coefficient of association, discuss
Whether there is association between literacy and unemployment.
Literate unemployed 220 persons
Literate employed 20 persons
Literate employed 180 persons
Total number of persons 500.
- State and prove multiplication theorem.
- Student A can solve a problem in statistics in 4 out of 5 chances and B can do it in 2 out of 3 chances
If both A and B try the problem, find the probability that the problem will be solved.
- After correcting the proofs of the first 50 pages of a book, it is found that on the average there are 3
errors per 5 pages. Use poisson probabilities and estimate the number of pages with 0,1,2,3 errors in
the whole book of 1000 pages (e-0.6=.5488)
15.What is Sampling Technique ? Explain different types of Sampling.
- Out of 8000 graduates in a town,800 are females and out of 1600 graduate employees 120 are
females. Use Chi-square to determine if any distinction is made in appointment on the basis of sex?
Test at 5% level.
- Explain the various types of control charts.
- You are given below the values of sample mean (X) and the range (R) for ten samples of size 5
Each. Draw mean and range charts and comment on the state of control of the process.
Sample No: 1 2 3 4 5 6 7 8 9 10
X: 43 49 37 44 45 37 51 46 43 47
R: 5 6 5 7 7 4 8 6 4 6
You may use the following :(for n=5, A2=0.58, D3=0, D4=2.11)
SECTION C
Answer any TWO questions: (2 X 20 = 40 Marks)
19.(a) Given (ABC) = 137; (αBC) = 261; (AβC) = 313; (ABg) = 284; (Abg) = 417; (αBg) = 420;
(αbC) = 490; (abg) = 508; Find the frequencies (AB), (A) and N. (10)
19.(b) ) There are 3 boxes containing respectively 1 White,2 Red, 3 block; 2 white,3 red, 1 black ball;
3 white , 1 red and 2 black ball. A box is chosen at random and from it two balls are drawn
At random. The two balls are 1 red and 1 white. What is the probability that they come from
(i) The first box (ii) second box (iii) third box. (10)
- (a) The customer accounts of a certain departmental store have an average balance of Rs.120 and a
standard deviation of Rs.40. Assuming that the account balances are normally distributed, find
- What proportion of accounts is over Rs.150?
- What proportion of accounts is between Rs.100 and Rs.150?
- What proportion of accounts is between Rs.60 and Rs.90 ? (10)
- (b) Random samples of 400 men and 600 women were asked whether they would like to have a fly-
over near their residence 200 men and 325 women were in favor of it. Test the equality of
proportion of men and women in the proposal? Test at 5% level. (10)
21.(a) The marks obtained by a group of 9 regular course students and another group of 11 part- time
course students in a test are given below:
| Regular | 56 | 62 | 63 | 54 | 60 | 51 | 67 | 69 | 58 | ||
| Part time | 62 | 70 | 71 | 62 | 60 | 56 | 75 | 64 | 72 | 68 | 66 |
Examine whether the marks obtained by regular students and part time students differ significantly at
5% level. (10)
- (b) The number of defects defected in 20 items are given below
Item No : 1 2 3 4 5 6 7 8 9 10 11 12 13 14 15 16 17 18 19 20
No. of defects: 2 0 4 1 0 0 8 1 2 0 6 0 2 1 0 3 2 1 0 2
Test whether the process is under control. Device a suitable scheme for future. (10)
- Perform two-way ANNOVA for the data given below:
| Treatment | ||||
| Plots of Land
I II III |
A
38 45 40 |
B
40 42 38 |
C
41 49 42 |
D
39 36 42 |
Using coding method subtracting 40 from the given number. (20)


