Loyola College M.Sc. Statistics April 2009 Advanced Distribution Theory Question Paper PDF Download

        LOYOLA COLLEGE (AUTONOMOUS), CHENNAI – 600 034

M.Sc. DEGREE EXAMINATION – STATISTICS

YB 33

FIRST SEMESTER – April 2009

ST 1810 – ADVANCED DISTRIBUTION THEORY


Date & Time: 28/04/2009 / 1:00 – 4:00  Dept. No.                                                    Max. : 100 Marks


SECTION – A                       Answer all the questions                                     (10 x 2 = 20)


  1. Find the mean of truncated binomial distribution, truncated at 0.
  2. Show that Posson distribution is a power series distribution
  3. Define lognormal distribution and show that the square of a lognormal variable is also lognormal.
  4. Show that the geometric distribution satisfies lack of memory property.
  5. Find the mean of X1X2 when (X1, X2) has a bivariate Poisson distribution.
  6. Let (X1, X2) have a bivariate binomial distribution. Find the distribution of X1+X2.
  7. Define bivariate lack of memory property..
  8. State the MGF associated with the bivariate normal distribution. Hence find the marginal

distributions.

  1. Let X1, X2, X3, X4 be independent standard normal variables. Examine whether

2X12 + 5 X22 + X32 +4 X42 – 2 X1X2 + 4 X2X3 + 4 X1X4 is distributed as chi-square.

  1. Let X be B( 2,q), q = 0.2, 0.3. If q is discrete uniform, find the mean of the compound

distribution.


SECTION – B                                Answer any five questions                           (5 x 8 = 40)


  1. State and establish a characterization of geometric distribution based on order statistics. 12. Find the

conditional distributions associated with trinomial distribution.

  1. If (X1, X2) is Bivariate Poisson, show that marginal distributions are Poisson.
  2. Derive the MGF of inverse Gaussian distribution. Hence find the mean and the variance.
  3. State and establish the relation between the mean, the median and the mode of lognormal

distribution.

  1. If (X1, X2) is Bivariate exponential, show that min{X1,X2}is exponential
  2. Find the mean and variance of non-central chi-square distribution.
  3. Given a random sample from a normal distribution, show that the sample mean and the sample

variance are independent, using the theory of quadratic forms.


SECTION – C                               Answer any two questions                         (2 x 20 = 40)


19 a) State and establish the  characterization of exponential distribution based on lack of memory

property.

  1. b) If (X1, X2) is Bivariate normal, state and establish a necessary and sufficient condition for two

linear combinations of X1 and X2  to be independent.

20 a) State and establish the additive property of  bivariate Poisson distribution.

  1. b) State and establish a characterization of Marshall-Olkin bivariate exponential distribution.

21 a) Define non-central t- variable and derive its pdf.

  1. b) State and establish the additive property of non-central chi-square distribution.

22 a) Let X be distributed as multivariate normal with mean vector µ and the dispersion matrix Σ. Show that

(X – µ )/ Σ -1(X – µ ) is distributed as chi-square.

  1. b) State and establish Cochran’s theorem on quadratic forms.
 

Go To Main page


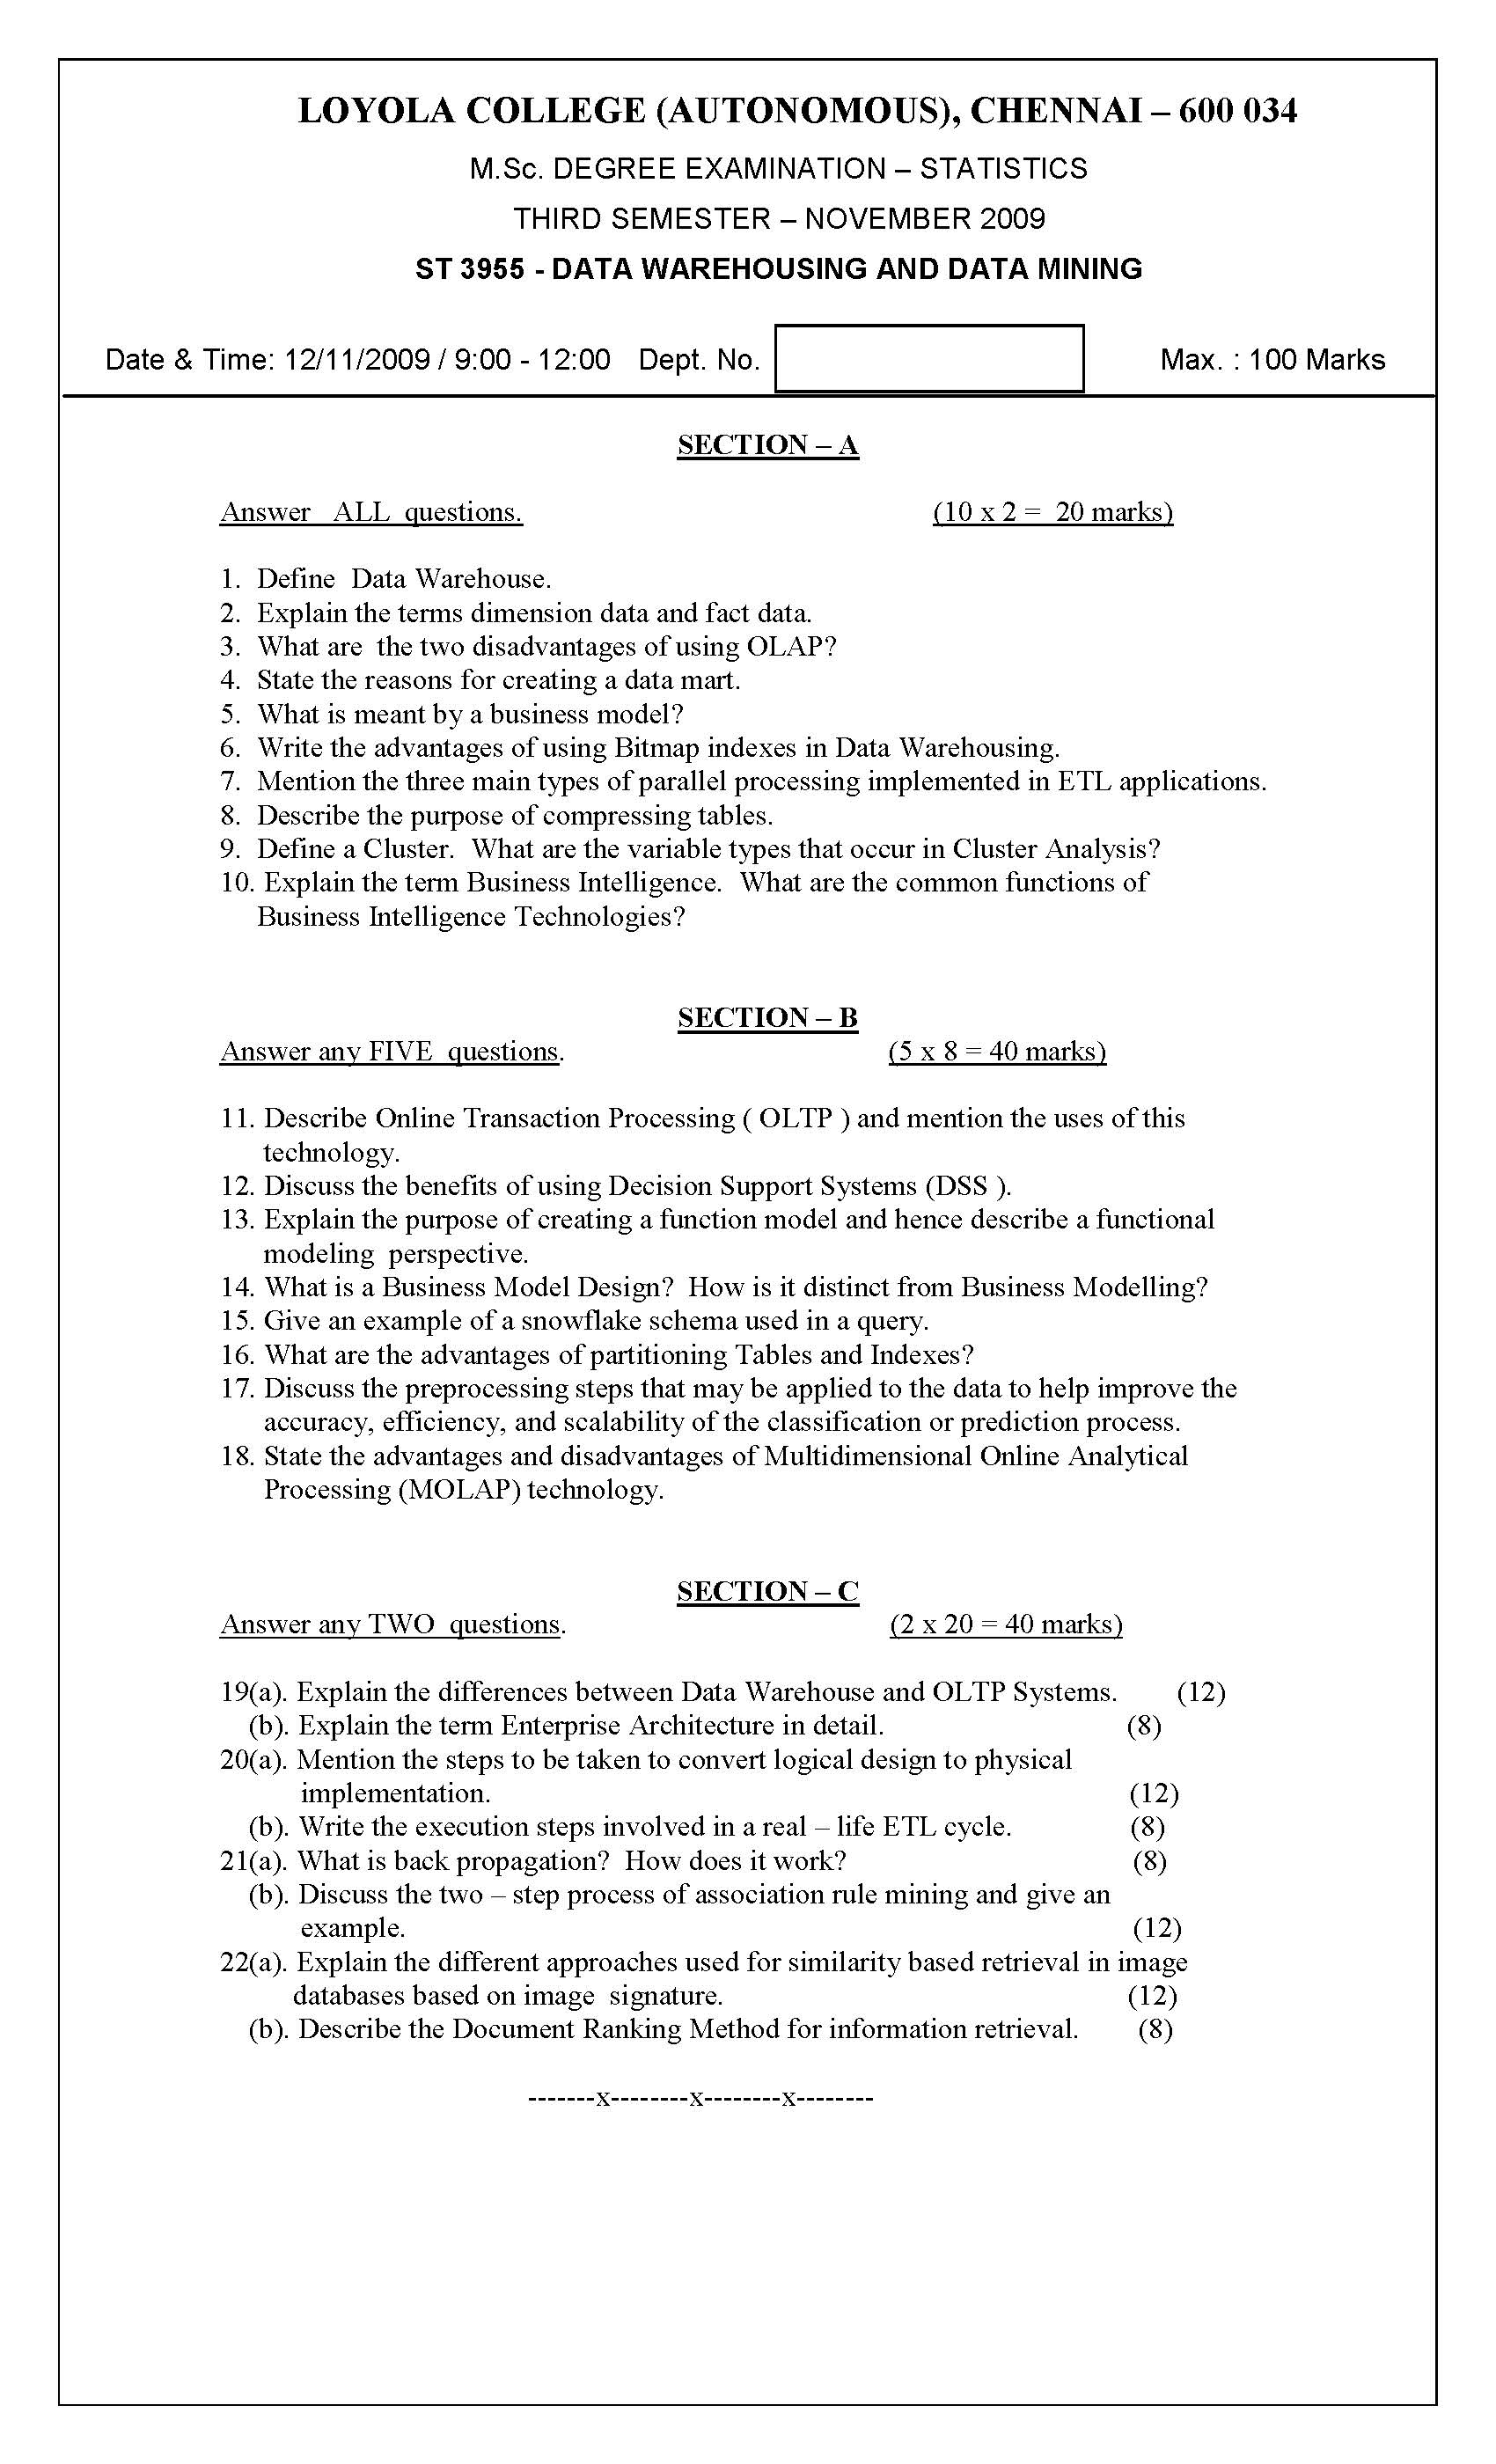
Loyola College M.Sc. Statistics Nov 2009 Data Warehousing And Data Mining Question Paper PDF Download

Go To Main page

Loyola College M.Sc. Statistics Nov 2009 Advanced Distribution Theory Question Paper PDF Download

Go To Main page

Loyola College M.Sc. Statistics April 2010 Estimation Theory Question Paper PDF Download

Go To Main page

Loyola College M.Sc. Statistics April 2010 Advanced Distribution Theory Question Paper PDF Download

Go To Main Page

Loyola College M.Sc. Statistics Nov 2010 Statistical Computing – II Question Paper PDF Download

LOYOLA COLLEGE (AUTONOMOUS), CHENNAI – 600 034

M.Sc. DEGREE EXAMINATION – STATISTICS

THIRD SEMESTER – NOVEMBER 2010

    ST 3814  – STATISTICAL COMPUTING – II


Date : 03-11-10                 Dept. No.                                        Max. : 100 Marks

Time : 9:00 – 12:00

Note :    SCIENTIFIC CALCULATOR IS ALLOWED FOR THIS PAPER


Answer any THREE questions                                                                               

1 a). Let {Xn, n=0,1,2,…} be a Markov chain with state space {0,1,2} and one step transition                 probabilities                                                                                                                                 (12)

P =

Find (i) P2  (ii)  (iii) P[X2 = 0] given X0 takes the values 0, 1, 2 with probabilities 0.3,

0.4, 0.3 respectively

b). Let {Xn, n=0,1,2,…} be a Markov chain with state space {0,1,2, 3, . . .} and transient function pxy ,          where p01= 1 and for x = 1, 2, 3,. . .                                                                                              (22)

  • Find f00(n) , n = 1, 2, 3 ,. . .
  • Find mean recurrence time of state 0.
  • Show that the chain is irreducible. Is it Ergodic?
  • Find for x = 0 ,1, 2 . . . whenever it exists
  • Find the stationary distribution, if it exists.

2  a) Consider two independent samples of sizes n1= 10 , n2 = 12 from two tri-variate normal

populations with equal variance-covariance matrices. The sample  mean vectors and the pooled

variance- covariance matrix are

,     and

Test whether the mean vectors of the two populations are equal                                                       (16)


  1. b) The distances between pairs of five objects are given below:

1     2      3     4      5


Apply the Single Linkage Algorithm to carry out clustering of the five objects.                                (18)


  1. Let X ~ B ( 1, θ ); θ = 0.1, 0.2, 0.3. Examine if UMP level 0.05 test exists for H : θ = 0.2 Vs

    K : θ = 0.1, 0.3. Otherwise find UMPU 0.05 test.                                                                                   (34)


  1. In a population with N = 4, the Yi values are 11,12,1 3,1 4,15. Enlist all possible samples of size n = 2, with SRSWOR and verify that E (s2) = S2.            Also Calculate the standard error of the sample mean.

(34)


5 (a) Marks secured by over one lakh students in a competitive examination were displayed in 39           display boards. In each board marks of approximately 3000 students were given. Kiran, a student         who scored 94.86 marks wanted to know how many candidates have scored more than him. In         order to estimate the number of student who have scored more than him, he took a SRS of 10         boards and counted the number of students in each board who have scored more than him. The        following is the data collected.

13, 28, 5, 12, 0, 34, 14, 41, 25 and 6.

Estimate the number of student who would have scored more than Kiran and also estimate the        variance of its estimate.                                                                                                                          (13)


(b) A sample of 30 students is to be drawn from a population consisting of 230 students belonging to       two colleges A and B. The means and standard deviations of their marks are given below:

Total no. of students(Ni) Mean Standard deviation(σi)
College X 150 25 7
College Y 80 50 32


How would you draw the sample using proportional allocation technique? Hence obtain the variance of estimate of the population mean and compare its efficiency with simple random sampling without replacement.                                                                                                                                        (21)


Go To Main Page


Loyola College M.Sc. Statistics Nov 2010 Multivariate Analysis Question Paper PDF Download

LOYOLA COLLEGE (AUTONOMOUS), CHENNAI – 600 034

M.Sc. DEGREE EXAMINATION – STATISTICS

THIRD SEMESTER – NOVEMBER 2010

    ST 3811  – MULTIVARIATE ANALYSIS


Date : 29-10-10                 Dept. No.                                        Max. : 100 Marks

Time : 9:00 – 12:00


SECTION – A

Answer ALL the following questions                                                                                  (10 x 2 = 20 marks)


  1. State and briefly explain any one broad objective for which multivariate analysis techniques are used.
  2. Define Variance-Covariance matrix of a random vector.
  3. Explain ‘Bubble Plot’ for three-dimensional data display.
  4. Define ‘Partial Correlation Coefficient’.
  5. Explain the dimensionality reduction role of Principal components.
  6. Distinguish between ‘Clustering’ and ‘Classification’.
  7. State any two similarity measures for pairs of items when variables are binary.
  8. State any one of the commonly employed scalings on the coefficient vector of the Fisher’s linear discriminant function and the interpretative use of the scaling.
  9. State the Hotelling’s T2 statistic for testing of hypothesis about the mean vector of a multivariate normal population.
  10. State the test for significance of the correlation coefficient in a bivariate normal population.


SECTION – B

Answer any FIVE questions                                                                                                 (5 x 8 = 40 marks)


  1. If is the sample mean vector and Sn is the sample var-cov matrix based on a random sample of size ‘n’ from a p-variate distribution with mean vector μ and Var-cov matrix Σ, show that Var-Cov() = Σ /n and Sn is a biased estimator of Σ.
  2. Explain the construction of ‘probability plots’ in general and the investigation of multivariate normality assumption in particular.
  3. If X ~ Np(μ, Σ ) and C is a non-singular matrix of order p x p, show that                CX ~ Np ( Cμ, CΣCT ). Hence, deduce the distribution of DX where D is a q x p matrix with rank q (≤ p).
  4. Under usual notations of partitions of a random vector and its var-cov matrix, with  = , show that ρ( Xi ,X(2) ) ≥ ρ( Xi , X(2) ) for every vector.
  5. Develop the MANOVA for comparing mean vectors of a number of normal populations and explain the test procedure for the same.
  6. Establish the relationship of principal components to the eigen values and eigen vectors of the var-cov matrix of the underlying random vector.
  7. State the three linkage methods for hierarchical clustering. Present a figurative display of the measure of between-cluster distances in each method.
  8. Derive the ‘Minimum ECM Rule’ for classification involving two multivariate normal populations with a common var-cov matrix.


(P.T.O)


SECTION – C

Answer any TWO questions                                                                                              (2 x 20 = 40 marks)


  1. (a) Describe the enhancement of scatter plots with ‘lowess’ curves.

(b) Develop the multivariate normal density function.                                                              (8 +12)


  1. (a) Derive the MLE’s of the parameters μ, Σ of multivariate normal distribution.

(b) Show that these MLEs are independently distributed.                                                         (12 + 8)


  1. Present the motivation, definition and derivation of Fisher’s (multiple) discriminant functions.


  1. (a) Present the ‘Orthogonal Factor Model’ in detail and develop the notions of ‘Communality’ and ‘Specific Variance’.

(b) Bring out the ambiguity in a factor model, the rationale for ‘factor rotation’ and explain the varimax criterion for factor rotation.                                                                                          (12 + 8)


Go To Main Page


Loyola College M.Sc. Statistics Nov 2010 Applied Regression Analysis Question Paper PDF Download

LOYOLA COLLEGE (AUTONOMOUS), CHENNAI – 600 034

M.Sc. DEGREE EXAMINATION – STATISTICS

FIRST SEMESTER – NOVEMBER 2010

    ST 1816  – APPLIED REGRESSION ANALYSIS


Date : 03-11-10                 Dept. No.                                        Max. : 100 Marks

Time : 1:00 – 4:00


SECTION – A

Answer all the questions.                                                                                                     10 x 2 = 20 marks

  1. Write any two properties of least squares estimators of multiple linear regression model.
  2. Distinguish between R2 and adjusted R2 statistics.
  3. Provide any two examples for linearizing non-linear models.
  4. Give an example for a quantitative regressor expressed in terms of indicator variables.
  5. Define Mallows’s CP statistic.
  6. Define ridge estimator.
  7. When do we use piecewise polynomial fitting?
  8. Write a note on kernel regression.
  9. Define logistic response function.
  10. Write a note on Poisson regression.


                                                                      SECTION-B

Answer any five questions                                                                                                    5 x 8 = 40 marks

  1. Show that the maximum likelihood estimator for the model parameters in multiple linear

regression when the model errors are normally and independently distributed are also least

square estimators.

  1. Explain the two popular scaling techniques in computing standardized regression

coefficients.

  1. Explain the fitting of regression model with two indicator variables.
  2. Write about four primary sources of multicollinearity among regressors.
  3. Write the procedure of principal components for obtaining biased estimators of regression

coefficients.

  1. How will you predict the response over the range of the data using locally weighted

regression approach ?

  1. How will you estimate parameters in a non-linear system?
  2. Briefly explain models with a binary response variable.


-2-


Section -C

 Answer any two questions                                                                                                2 x 20 = 40 Marks.


  1. (a) Derive the least squares estimators of model parameters for multiple linear regression

model.

(b) Carryout the test for significance of regression for a multiple linear regression model.

(10 + 10 Marks)


  1. (a) Present a formal statistical test for the lack of fit of a regression model.

(b) Explain some variance stabilizing transformations.                                    (15 + 5 Marks)


  1. (a) Explain piecewise polynomial fitting (splines).

(b) Elaborately write the use of orthogonal polynomials in fitting regression models.

(10+10) marks


  1. (a) Explain the fitting of polynomial models in two or more variables.

(b) Write about Link functions, linear predictor and canonical link for the generalized linear

model.                                                                                                       (10 + 10 Marks)


Go To Main Page


Loyola College M.Sc. Statistics April 2011 Statistical Computing I Question Paper PDF Download

LOYOLA COLLEGE (AUTONOMOUS), CHENNAI – 600 034      LOYOLA COLLEGE (AUTONOMOUS), CHENNAI – 600 034    M.Sc. DEGREE EXAMINATION – STATISTICSFIRST SEMESTER – APRIL 2011ST 18167 – STATISTICAL COMPUTING  I
Date : 20-04-2011 Dept. No.   Max. : 100 Marks    Time :                                              Answer all the questions              (4 x 25 =100 Marks)
1 a)  The following frequency distribution gives the number of albino children in families of five children          having at least 1 albino child:No. of Albinos (x) No. of Families (f)1 222 263 94 25 1
Fit a truncated binomial distribution for the above frequency distribution and test the goodness of          fit  at 5% level.
b)  Fit a normal distribution to the following data by area method   and   test   the goodness   of  fit               at 5%  level of significance:x f40 – 60 860 – 80 1280 – 100 20100 – 120 25120 – 140 45140 – 160 22160 – 180 16180 – 200 16200 – 220 4
( 15 +10)    (OR)
c) The table below gives the frequency distribution of the number  of dust nuclei in a small volume         of air that fell on to a stage in a chamber containing moister and filtered air: No.  of dust nuclei (x) 1 2 3 4 5 6 7 8f 60 84 98 70 37 20 5 3
It is suspected that a number of zero counts were wrongly rejected on the ground that the apparatus   was not working and hence not recorded.  Fit a truncated Poisson distribution to the above frequency distribution and test the goodness of fit.
d)   For the following frequency distribution, fit a negative binomial distribution and test the            goodness    of fit  at 5% level: x 0 1 2 3 4 5f 212 128 40 15 3 2

2  a)  Generate a sample of size 5 from the  Bivariate  normal distribution given below:     (OR)       b) Given the three selected points U1,    U2 and    U3 corresponding to t1 = 2 , t2 = 30 and                         t3 = 58 as follows:           t1 = 2,                U1 = 55.8               t2 = 30,             U2 = 138.6                t3 = 58,             U3 = 251.8
Fit a logistic curve by the method of selected points. Also obtain the trend values         for t = 5, 18, 25, 35, 46, 50, 54, 60, 66, 70.
3. a)Find the inverse of the following matrix A using partitioning method:                     A =      (Or)         b) (i)  Obtain the Rank, Index and Signature of the following matrix A:                          A  =
(ii) Verify whether or not the following matrix is negative definite:
B  =                                                                                     (15 + 10)
4)     a) Determine Tolerance and Variance Inflation Factor(VIF) for each explanatory variable based               on the data and fitted auxiliary regression equations given below:Y 8 9 7 5 6 4 5 2 1 3X1 5.2 5.6 4.8 4 6 5 4.5 2.3 1.5 2.6X2 5.1 5.2 4.7 3.2 3.2 5.4 3.9 2.6 1.8 2.1X3 2.3 1.2 1.5 1.6 1.4 1.8 1.9 1.8 1.5 1.6

Fitted Auxiliary regression equations areX1 = 2.211 + 0.95X2 -0.961X3X2 = -0.805 + 0.704X1 + 0.966X3X3 = 1.568 – 0.102 X1 + 0.139X2
(OR)
Y 1 0 1 0 0 0 0 1 0 0 0 0 0 0 1 0 0 0 0 1X1 2.45 1.2 2.5 2.14 1.6 2.19 2.1 2.8 1.5 2.8 2.18 1.1 2.22 2.23 1.5 2.11 2 1.9 1.4 2.7X2 0 1 0 0 1 1 0 0 0 1 0 1 0 0 1 1 0 0 0 1X3 1 0 1 1 0 1 0 0 0 0 1 0 1 1 0 1 0 0 0 0b) Consider the following data and the fitted Logistic regression model  Determine the following:(i) Optimal Cut point based on Gains table                                                        (ii)     Classification table based on the optimal cut point , Sensitivity and Specificity.(18+7)


Go To Main Page

Loyola College M.Sc. Statistics April 2011 Estimation Theory Question Paper PDF Download

LOYOLA COLLEGE (AUTONOMOUS), CHENNAI – 600 034

M.Sc. DEGREE EXAMINATION – STATISTICS

SECOND SEMESTER – APRIL 2011

ST 2811 / 2808 – ESTIMATION THEORY


Date : 2/4/2011                Dept. No.                                        Max. : 100 Marks

Time : 1:00 – 4:00


SECTION – A


Answer all the questions                                                                                           (2×10=20)

  1. Define Minimal Sufficient Statistic
  2. Define Efficient Estimator
  3. Define Ancillary Statistic
  4. State the different approaches to identify UMVUE
  5. Define Likelihood Equivalence
  6. Define D –optimality
  7. Define Location-Scale Family
  8. Define Minimum Risk Equivariant Estimator(MREE)
  9. Define CAN estimator
  10. Define Maximum Likelihood Estimator


SECTION – B


Answer any five questions                                                                                        (5×8 = 40)

  1. Obtain UMVUE of θ(1- θ) using a random sample of size n drawn from a Bernoullie population with parameter θ
  2. State and Establish Rao-Blackwell theorem
  3. State and Establish Neyman-Fisher Factorization theorem
  4. i) Let L be squared error then MREE of θ is unique                                        (4)
  5. ii) Let X1,X2,…,Xn be a random sample from N(θ,1), Show that (4)
  6. Let δ be a LEE and L be invariant then show that    i)The Bias of δ is free from θ

and ii) Risk of δ is free from θ                                                                                    (4+4)

  1. i) State and Establish Basu’s theorem (6+2)
  2. ii) Define UMRUE
  3. Determine MREE of θ in the following cases i) N(θ,1) , θ Î R ii)E(θ,1) , θ ÎR


  1. Let X1,X2,…,Xn be a random sample from population having pdf


obtain MLE of P(X>2)


SECTION – C

Answer any two questions                                                                                        (2×20 = 40)

  1. i) Establish: If UMVUE exists for a parametric function Ψ(θ), It has to be essentially unique (10)
  2. ii) State and Establish Cramer-Rao Inequality for multi-parameter case and hence deduce the inequality for single parameter (10)
  3. Establish: δ*Î Ug is D-optimal if and only if each component of δ* is UMVUE
  4. i) Let X1,X2,…,Xn be a random sample from N(µ,σ2). Obtain Cramer-Rao lower bound for estimating (16)
  5. i) µ ii) σ2                 iii) µ+σ                                 iv) σ/ µ
  6. ii) Establish: Let T be a sufficient statistic such that T(x) = T(y) then           (4)
  7. i) Establish: Let δ* belong to the class of LEEs. Then δ* is a MREE with respect to squared error if and

only if E(δ*u)=0                                                                                           (10)

  1. ii) Let X1,X2,…,Xn be a random sample drawn from a normal population with mean θ and variance σ2

Find the MLE of θ and σ2 when both θ and σ2 are unknown                                (10)


Go To Main Page

Loyola College M.Sc. Statistics April 2011 Applied Experimental Design Question Paper PDF Download

LOYOLA COLLEGE (AUTONOMOUS), CHENNAI – 600 034

M.Sc. DEGREE EXAMINATION – STATISTICS

FOURTH SEMESTER – APRIL 2011

ST 4809 / 4805 – APPLIED EXPERIMENTAL DESIGN


Date : 5/4/2011                Dept. No.                                        Max. : 100 Marks

Time : 9:00 – 12:00

SECTION – A


Answer all the questions                                                                                         (10 x 2  = 20 marks)


  1. State the linear model used in 23 factorial design
  2. Briefly explain the term Blocking.
  3. When do we go for repeated L.S.D ?
  4. State Fermat’s theorem.
  5. Define the term linear contrast with an example.
  6. State the missing formula for RBD.
  7. Define a resolvable BIBD with an example .
  8. Distinguish between RBD and BIBD.
  9. Give any two advantages of factorial design.
  10. State any two applications of response surface design.


SECTION-B


Answer any Five questions                                                                                     (5 x 8  = 40 marks)


  1. Distinguish between CRD and RBD and derive the efficiency of RBD over CRD.
  2. Describe the analysis of variance for a GRAECO-LATIN SQUARE, stating all the

Hypothesis,  ANOVA and conclusions.

  1. Define mutually orthogonal contrast and show that in 23 design the

main effects and interaction effects are mutually orthogonal.


  1. Discuss in detail the need for a Nested design with suitable illustration.
  2. Describe, the analysis of variance for a 33 factorial design, stating all the

hypothesis, ANOVA and conclusions.

  1. Develop the analysis of variance for a 24 completely confounded factorial design.
  2. State clearly the model used in the case of Youden Square and construct a real life

example.

  1. Describe in detail the LINEAR and QUADRATIC response surface Designs.


SECTION-C


Answer any Two questions                                                                                         (2 x 20  = 40 marks)


  1. Discuss in detail the real life scenario of application of experimental designs in
  2. i) Agriculture ii) Industry  iii) Health sciences. (  6+7+7 marks)


20.a) Define the term key BLOCK in the case of  25 factorial design of size 23 in

which 2 independent interactions and 1 generalized interaction are Confounded

Discuss in detail using the required linear equations for the confounded effects.


  1. b) State and prove any one of the parametric conditions of a BIBD

(15 +5-Marks)


21 a) When do we go for PBIBD?

  1. b) Construct a PBIBD with 2 associate classes stating all the parametric conditions
  2. c) Explain the m-ple Lattice Square design and hence construct lattice square design

when the block size k=3.                   (2+8+10-Marks)


22 Write short notes on the following

  1. Replication
  2. MOLS
  3. Partial Confounding
  4. Split plot (5+5+5+5-Marks)


Go To Main Page

Loyola College M.Sc. Statistics April 2011 Advanced Operations Research Question Paper PDF Download

LOYOLA COLLEGE (AUTONOMOUS), CHENNAI – 600 034

M.Sc. DEGREE EXAMINATION – STATISTICS

FOURTH SEMESTER – APRIL 2011

ST 4811/4807 – ADVANCED OPERATIONS RESEARCH


Date : 09-04-2011             Dept. No.                                        Max. : 100 Marks

Time : 9:00 – 12:00

Section A


Answer ALL questions.                                                                                  (10 x 2 =20 marks)

  1. Define General Linear Programming Problem.
  2. Define Pure Integer Programming Problem.
  3. What is the need for inventory control?
  4. What is the behaviour of customers in a queue?
  5. Define dynamic Programming Problem.
  6. What do you mean by Non Linear Programming Problem?
  7. Define a chance constrained model.
  8. Show that Q = 2 x12 + 2 x22 + 3 x32 + 2 x1 x2 + 2 x2 x3 is positive definite.
  9. Write the significance of Goal Programming.
  10. State the use of simulation analysis.


SECTION B


Answer any FIVE questions.                                                                    (5 x 8 =40 marks)


  1. Apply the principle of duality to solve the following: Min Z = 2 x1 + 2 x2 , subject to the constraints,     2 x1 +  4 x2 ≥ 1,   x1 + 2 x2 ≥ 1,  2 x1 + x2 ≥ 1,      x1 , x2 ≥ 0.
  2. Explain Generalized Poisson queuing model.
  3. Explain the classical EOQ model.
  4. Derive Gomory’s constraint for solving a Mixed Integer Programming Problem.
  5. Use Dynamic Programming Problem to solve the following LPP; Max Z =  3 x1 + 5 x2 subject to the constraints,     x1  ≤ 4, x2  ≤ 6,    3 x1 + 2 x2 ≤ 18,    x1 , x2 ≥ 0.
  6. Derive the KTNC for solving a GNLPP with one inequality constraint.


  1. Find the deterministic equivalent of the following problem: Min Z =  3 x1 + 4 x2 subject to the constraints,     P[ 3 x1 – 2x2  ≤ b1] ≥ ¾,  P[  x1/7 + 2x2  ≥ b2;  x1 + x2 /9 ≥ b3] = 1/4 , x1 , x2 ≥ 0, where b1, b2, and b3 are independent random variables uniformly distributed in the intervals     (-2, 2), (0, 2), (0, 4) respectively.
  2. An electronic device consists of 4 components, each of which must function for the system to function. The system reliability can be improved by installing parallel units in one or more of the components. The reliability R of a component with 1, 2 or 3 parallel units and the corresponding cost C ( in 000’s) are given in the following table. The maximum amount available for this device is  Rs. 1,00,000. Use DPP to maximize the reliability of the entire system.
  j = 1 j = 2 j = 3 j = 4
Uj R1 C1 R2 C2 R3 C3 R4 C4
1 .7 10 .5 20 .7 10 .6 20
2 .8 20 .7 40 .9 30 .7 30
3 .9 30 .8 50 .95 40 .9 40


SECTION C


Answer any TWO questions.                                                                          (2 x 20 =40 marks)


  1. Explain Branch and Bound algorithm for solving MIPP and hence solve the following problem:

Max z = 3 x1+  x2  + 3 x3   subject to the following constraints, – x1+  2 x2  +  x3 ≤ 4,

4 x2 – 3 x2   ≤ 2,  x1 –  3 x2  +  2 x3 ≤ 3,   x1 , x2 , x3  ≥ 0, x1 , xare integers.


  1. Solve the following GNLPP using KTNC, Max Z = 2 x1 – x12 + x2  subject to the constraints,         2 x1 + 3 x2 ≤ 6, 2 x1 + x2 ≤ 4,    x1,  x2 ≥ 0.


  1. Max Z = 6 x1 + 3 x2 – 4 x1 x2 – 2 x12 – 3 x22 subject to the constraints,     x1 +  x2 ≤ 1,

2 x1 + 3 x2 ≤ 4,    x1 , x2 ≥ 0. Show that z is strictly concave and then solve the problem by Wolfe’s algorithm.

  1. (i) Derive steady state measures of performance for (M│M│1) : (GD│∞│∞) queue system.

      (ii) Explain multi-item EOQ model with storage limitation.                                                                                          


Go To Main page


Loyola College M.Sc. Statistics April 2012 Testing Statistical Hypotheses Question Paper PDF Download

LOYOLA COLLEGE (AUTONOMOUS), CHENNAI – 600 034

M.Sc. DEGREE EXAMINATION – STATISTICS

SECOND SEMESTER – APRIL 2012

ST 2812 – TESTING STATISTICAL HYPOTHESES


Date : 19-04-2012             Dept. No.                                        Max. : 100 Marks

Time : 9:00 – 12:00


SECTION – A


Answer  ALL  questions.  Each  carries TWO  marks:                                                 (10 x 2 =  20 marks)


  1. How do the Loss and Risk functions quantify the consequences of decisions?


  1. Specify the three elements required for solving a decision problem.


  1. Describe a situation where the decision rule remains invariant or symmetric.


  1. Define Bayes Rule and Bayes Risk.


  1. Illustrate that the consequences of Type I error and Type II error are quite different.


  1. Define Most Powerful Test of level α.


  1. Write UMPT for one parameter exponential family for testing

(i)  H: θ ≤ θ0 versus K: θ > θ0 when Q (θ) is increasing

(ii) H: θ ≥ θ0 versus K: θ < θ0 when Q(θ) is decreasing.


  1. When do we say that a test  has Neyman Structure?


  1. State any two asymptotic results regarding likelihood equation solution.


  1. What is an invariant test?


SECTION – B


Answer any FIVE questions.  Each carries EIGHT marks:                                              (5 x 8 = 40 marks)


  1. Distinguish between randomized and non-randomized tests and give an example for

each test.


  1. Let ‘N’ be the size of a lot containing ‘D’ defectives, where ‘D’ is unknown. Suppose a

sample of size ‘n’ is drawn and the number of defectives ‘X’ in the sample is observed.

Obtain UMPT of level α for testing H: D ≤ D0 versus K: D > D0.


  1. Let ‘X’ denote the number of events observed during a time interval of length ‘τ’ in a

Poisson process with rate ‘λ’.  When τ = 1, at 5% level, find the power at λ = 1.5 of the

UMPT for testing H: λ ≤ 0.5 versus K: λ > 0.5.


  1. Obtain the UMPUT for H: p = p0 versus K: p ≠ p0 in the case Binomial distribution

with known ‘n’ and deduce the ‘side conditions’ that are required to be satisfied.


  1. State and prove a necessary and sufficient condition for similar tests to have Neyman

structure.


  1. If X ~ P (λ1) and Y ~ P (λ2) and are independent, then compare the two Poisson populations

through UMPUT for H: λ1 ≤ λ2 versus K: λ1 > λ2, by taking random sample from P (λ1) and

P (λ2) of sizes ‘m’ and ‘n’ respectively.


  1. Show that a test is invariant if and only if it is a function of a maximal invariant statistic.


  1. Using a random sample of size ‘n’ from N(μ, 1), derive the likelihood ratio test of level α

for testing H: μ = 0 against K: μ ≠ 0.


SECTION – C


Answer  any TWO  questions.  Each  carries TWENTY  marks:                               ( 2 x 20 =  40 marks)


  1. State and prove the existence, necessary and sufficiency parts of Neyman-Pearson

Fundamental Lemma.


20(a) For a two decision problem, with zero loss for a correct decision, prove that every

minimax procedure is unbiased.                                                                        (10)


(b) Prove that an unbiased procedure is minimax if Pθ(A) is a continuous function of θ

for every event ‘A’ and there is a common boundary point of Θ0 and Θ1.        (10)


  1. Let X1, … , Xn be a random sample from E(a, b), where ‘a’ is unknown and ‘b’ is

known.  Using the UMPT for testing H: θ = θ0 versus K: θ ≠ θ0 in U(0, θ), obtain the

UMPT for testing H: a = a0 versus K: a ≠ a0 and find its power function.


22(a) Derive the conditional UMPUT of  level α for testing the independence of  attributes

in a 2 x 2 contingency table.                                                                               (16)


(b) Discuss the criteria for choosing the value of significance level α.                     (4)


Go To Main page


Loyola College M.Sc. Statistics April 2012 Stochastic Processes Question Paper PDF Download

LOYOLA COLLEGE (AUTONOMOUS), CHENNAI – 600 034

M.Sc. DEGREE EXAMINATION – STATISTICS

THIRD SEMESTER – APRIL 2012

ST 3812/3809 – STOCHASTIC PROCESSES


Date : 24-04-2012             Dept. No.                                        Max. : 100 Marks

Time : 1:00 – 4:00

Section – A

       Answer all the questions:                                                                                         10 x 2 = 20 marks

  1. Define convergence in quadratic mean.
  2. Define periodicity and aperiodicity of a Markov chain.
  3. Give an example for a reducible Markov chain.
  4. Write the infinitesimal generator of a birth and death process.
  5. Write any two applications of Poisson process.
  6. Provide any two examples for renewal process.
  7. Define a super martingale.
  8. Define discrete time branching process.
  9. Write a note on stationary process.
  10. Write different types of stochastic processes.


Section – B

Answer any five questions:                                                                                          5 x 8 = 40 marks

  1. Explain (i) martingale   (ii) point process
  2. Explain one-dimensional random walk.
  3. (a) Show that a state i is recurrent if and only if iin = .
  • If i j and if i is recurrent show that j is recurrent.                                              (4+4)
  1. Derive Pn(t) for the Yule process with X(0) = 1.
  2. Derive the mean for a birth and death process if λn = nλ + a and μn = nμ with λ > 0 , μ >0 and a>0.
  3. Explain (i) renewal function   (ii) excess life   (iii) current life  (iv) mean total life
  4. Explain Markov branching process with three examples.
  5. Write a note about (i) stationary process on the circle (ii) stationary Markov chains.


Section – C

Answer any two questions:                                                                                        2 x 20 = 40 marks


  1. (a) Show that state 0 is recurrent for a two dimensional random walk.

(b) Derive the basic limit theorem of Markov chains.                                                   (5+15)


  1. For the gambler’s  ruin  on (n+1) states  with  P(Xn+1 = i+1  |  Xn = i ) = p ,

P(Xn+1 = i-1  |  Xn = i ) = q  and  0 and n are absorbing states , calculate ui  = (C0 )  and  v i ( Cn) .

  1. (a) Derive the differential equations for pure birth process.

(b) Derive Pn(t)  for Yule process  with X(0) = N.                                                      (10 + 10)

  1. (a) State and prove the basic renewal  theorem.

(b) Derive mean and variance of  branching process.                                                (10 + 10)


Go To Main page


Loyola College M.Sc. Statistics April 2012 Statistical Process Control Question Paper PDF Download

LOYOLA COLLEGE (AUTONOMOUS), CHENNAI – 600 034

M.Sc. DEGREE EXAMINATION – STATISTICS

FOURTH SEMESTER – APRIL 2012

ST 4810 / 4806 – STATISTICAL PROCESS CONTROL


Date : 18-04-2012             Dept. No.                                        Max. : 100 Marks

Time : 1:00 – 4:00

Section – A

Answer all the questions:                                                                                                         ( 10 x 2 =20)

  1. Give a typical application of Acceptance Sampling
  2. What is lot sentencing?
  3. Name the two control charts that detect small process shifts.
  4. In what steps of DMAIC is process capability analysis used and name a technique used for the same?
  5. When do we go for Attributes Control Chart?
  6. When do we go for ?
  7. What are the tools used in Analyze step of DMAIC?
  8. What are USL and LSL?
  9. What are the three components of Juran Trilogy?
  10. Discuss the major disadvantages of Shewart Control Chart.


    Section – B

Answer any five questions:                                                                                                       ( 5 x 8 =40)


  1. Elucidate on Single Sampling plans for attributes.
  2. What is the Variable Width Control Limit approach with respect to a p chart?
  3. Describe the construction of c chart when we have 2 cases
  4. a) Standards given
  5. b) Standards not given.
  6. Explain OC Curve. Why do we need it?
  7. What are the different types of Control Chart?
  8. Give a note on the Define Step of the DMAIC
  9. Explain in detail SIPOC diagram.
  10. Define the notations  ,Cp and p with respect to process capability. Diagrammatically represent the scenarios wherein Cp=1, Cp<1 and Cp>1.


Section – C

Answer any two questions:                                                                                                     ( 2 x 20 =40)


  1. a)What is Acceptance Sampling and what are the three important aspects of it?

b)Discuss the single, double and multiple Sampling Plan in detail.

  1. a)Describe the construction of CUSUM charts.

b)Give a brief description of the tools used in different stages of DMAIC

  1. a)Discuss the three statistical methods for Quality Control and Improvement.

b)What are the three approaches followed in the construction of p chart when we have a variable sample size?

  1. a)Describe briefly the Phase 1 and Phase 2 of Control chart application

b)Explain the role of Design of Experiment in SPC.


Go To Main page


Loyola College M.Sc. Statistics April 2012 Statistical Computing – III Question Paper PDF Download

LOYOLA COLLEGE (AUTONOMOUS), CHENNAI – 600 034

M.Sc. DEGREE EXAMINATION – STATISTICS

FOURTH SEMESTER – APRIL 2012

ST 4812 – STATISTICAL COMPUTING – III


Date : 23-04-2012             Dept. No.                                        Max. : 100 Marks

Time : 1:00 – 4:00


Answer any THREE questions

WEEK-II
  • Develop the ANOVA for R.L.S.D from the given data: (34)

WEEK-I

  VIVEK VASANTH CHELLA

MANI

VGP
MON A12 B 22 C 18 D 18
TUE B 15 C 30 D 22 A 22
WED C 18 D 40 A 14 B 15
THU D 20 A 50 B 17 C 20
  VIVEK VASANTH CHELLA

MANI

VGP
MON A14 B 24 C 18 D 21
TUE B 12 C 31 D 23 A 25
WED C 19 D 39 A 14 B 17
THU D 24 A 56 B 18 C 23


WEEK-III


  VIVEK VASANTH CHELLA

MANI

VGP
MON A13 B 25 C 17 D 23
TUE B 14 C 33 D 23 A 26
WED C 20 D 38 A 15 B 16
THU D 20 A 57 B 19 C 24


  1. (a) Solve the following LPP by solving its Dual problem :                                                (16+18)

Max Z = 6X +8Y


Subject to, 5X +2Y ≤ 20

                                                X +2Y ≤ 10

and X, Y ≥0

(b) Solve the following LPP by Big-M Method:

Max Z = 5X1 -4 X2+ 3X3

Subject to,      2X1 +X2 -6 X3= 20

                                                              6X1 +5X2+10 X3 ≤ 76

8X1 -3X2+6 X3 ≤ 50

and X1, X2 ,X3≥0

  1. (a) At public telephone booth in a post office, arrivals are considered to be Poisson,        with an average inter-arrival time of 12 minutes. The length of a phone call may        be assumed to be distributed exponentially with an average of 4 minutes.               Calculate the following.

(i) What is the probability that a fresh arrival will have to wait for the phone?

(ii) Find the average number of units in the system.

(iii) What is the average length of the queue that forms from time to time?


(b) Surface defects on 20 steel plates were counted and the data are reported below:

1       4        3        1        2        5        0        2        1        8

2        1        3        4        6       5        3         1       4        2

Construct the relevant control chart for the process. Compute the OC function when the      average number of defects increases to: 4.5,   5.0,   5.5,    6.0,    6.                   (16+18)


  1. In a study carried by agronomist to determine if major differences in yield response to N fertilizer exist among different variables/ varieties of jowar. The main plot treatments were 3 varieties of jowar ( V1: CO-18, V2: CO-19 and V3: CO-22) and the sub- plot treatment were N rates of 0, 30 and 60 kg/ ha. The study was replicated 4 times, and the  data gathered for the experiment are shown in table


Replication variety N rate, kg/ha

             0                     30                         60


I

V1 14.5 16.5 19.8
V2 19.5 23.5 29.2
V3 14.6 17.2 17.5


II

V1 17.9 19.2 23.5
V2 14 19.5 17.9
V3 15 14.8 17.3


III

V1 11.9 13.5 12.5
V2 19.2 17.5 24.5
V3 14.9 19.5 21.5


IV

V1 11.9 12.5 17.5
V2 12.5 16.5 13.9
V3 11.5 10.9 9.5


Analysis the above data by using split plot design.                                                                            (34)


  1. (a) Construct an Exponentially-Weighted Moving Average Control Chart for the following data on temperatures of a chemical process (in degrees centigrade) with the latest data point getting weight 0.3:

953,   949,   937,   958,   952,   946,   939,   955,   931, 954,   963,   927,   941,   938,   957


(b) Compute the OC function and ASN of the Double Sampling Plan (n1 = 25, c1 = 2,

n2 = 10, c2 = 4) corresponding to the lot fraction defective values p = 0.02, 0.04, 0.06,                  0.08, 0.10, 0.12.

(15 + 19)


Go To Main page

Loyola College M.Sc. Statistics April 2012 Statistical Computing – II Question Paper PDF Download

LOYOLA COLLEGE (AUTONOMOUS), CHENNAI – 600 034      LOYOLA COLLEGE (AUTONOMOUS), CHENNAI – 600 034    M.Sc. DEGREE EXAMINATION – STATISTICSTHIRD SEMESTER – APRIL 2012ST 3814/3810 – STATISTICAL COMPUTING – II
Date : 26-04-2012 Dept. No.   Max. : 100 Marks    Time : 1:00 – 4:00

Answer any THREE questions:  a) For three state Markov chain with states {0,1,2} and transition probability matrix                 P =    [■(1/3&0&2/3@0&1/2&1/2@1/2&1/4&1/4)]  ,                            Find the mean recurrence transients of states 0, 1, 2.                                                (22)                b). Let {Xn, n=0,1,2,…} be a Markov chain with state space {0,1,2} and one step transition          probabilities            (12)   P =    [■(0.6&0.1&[email protected]&0.5&[email protected]&0.2&0.6)]                         Find (i) P2  (ii)   (iii) P[X2 = 0] given X0 takes the values 0, 1, 2 with probabilities 0.3,                                   0.4, 0.3 respectively         2.  Let X ~ B ( 1, θ ); θ = 0.1, 0.2, 0.3. Examine if UMP level 0.05 test exists for H : θ = 0.2  Vs                      K : θ = 0.1, 0.3. Otherwise find UMPU 0.05 test. (34)
In a population with N = 5, the Yi values are 9,10,1 1,12,13. Enlist all possible samples of size n = 2, with SRSWOR and verify that E (s2) = S2.Also Calculate the standard error of the sample mean.  (34)            4. a) Given the normal distribution Np (μ, ∑)                   µ =    ,   ∑ =                     Find the conditional distribution of X1 and X2 given X3 = 205 (16)


b) The distances between pairs of five objects are given below:                               1     2      3     4      5                       ■(1@2@3@4@5)  (■(0&&&&@9&0&&&@3&10&0&&@11&6&8&0&@12&7&4&10&0))                      Apply the Single Linkage Algorithm to carry out clustering of the five objects.           (18)
(a) Consider a population of 5 units with values 1,2,3,4,5. Write down all possible samples of (without replacement) from this population and verify that sample mean is an unbiased estimate of the population mean. Also calculate its sampling variance and verify that it agree with the formula for the variance of the sample mean, and this variance is less than the variance obtained from sampling with replacement.     (13)       (b) A sample of 30 students is to be drawn from a population consisting of 410 students belonging to            two colleges A and B. The means and standard deviations of their marks are given below:  Total no. of students(Ni) Mean Standard deviation(σi)College X 230 40 14College Y 180 25 9

How would you draw the sample using proportional allocation technique? Hence obtain the variance of estimate of the population mean and compare its efficiency with simple random sampling without replacement.   (21)


Go To Main page

Loyola College M.Sc. Statistics April 2012 Statistical Computing – I Question Paper PDF Download

LOYOLA COLLEGE (AUTONOMOUS), CHENNAI – 600 034

M.Sc. DEGREE EXAMINATION – STATISTICS

FIRST SEMESTER – APRIL 2012

ST 1817 – STATISTICAL COMPUTING – I


Date : 03-05-2012             Dept. No.                                        Max. : 100 Marks

Time : 9:00 – 12:00

  1. a) For the following frequency distribution fit a poisson distribution and test the goodness of fit at 5 % level. (12 marks)


X f
0 212
1 128
2 37
3 18
4 3
5 2


  1. b) The following data gives the frequency of accidents in a city during 100 weeks.


No. of accidents No.of weeks
0 25
1 45
2 19
3 5
4 4
5 2


Fit a distribution of the form  P (X = x ) =  for the given data and test goodness of fit at 5 %  level.                                                              (21 marks)


  1. a) Five biased coin were tossed simultaneously 1000 times and at each toss the no. of heads was observed. The following table gives the no.of heads together with its frequency (17 marks)


       X

( no. of heads)

0 1 2 3 4 5
f(x) 38 144 342 287 164 25


Fit a binomial distribution to the above data and test whether the fit is good at 5 % level.


b)

Travel time Y 9.3 4.8 8.9 6.5 4.2 6.2 7.4 6 7.6 6.1
No.of deliveries 4 3 4 2 2 2 3 4 3 2
Miles travelled 100 50 100 100 50 80 75 65 90 90


  • Build a multiple linear regression model for the above data.
  • Determine                                                                                                  (17 marks)


  1. a) Find the inverse of the following matrix using partitioning method.


A =                                                                             (23 marks)


  1. b) Find the rank of A, where A = (10 marks)


4.a)  Determine the characteristic roots and vectors of the matrix


(15 marks)


  1. b) Write the quadratic forms of the matrix


A =                                                                  (18 marks)


5.Compute tolerance and variance inflation factor for each explanatory  variable based on auxiliary regression equation and the  given data .


Y
8 5.2 5.1 2.3
9 5.6 5.2 1.2
7 4.8 4.7 1.5
5 4 3.2 1.6
6 6 3.2 1.4
4 5 5.4 1.8
5 4.5 3.9 1.9
2 2.3 2.6 1.8
1 1.5 1.8 1.5
3 2.6 2.1 1.6


(33 marks)


Go To Main page

Loyola College M.Sc. Statistics April 2012 Sequential And Non Parametric Methods Question Paper PDF Download

LOYOLA COLLEGE (AUTONOMOUS), CHENNAI – 600 034

M.Sc. DEGREE EXAMINATION – STATISTICS

SECOND SEMESTER – APRIL 2012

ST 2959 – SEQUENTIAL AND NON PARAMETRIC METHODS


Date : 24-04-2012             Dept. No.                                        Max. : 100 Marks

Time : 9:00 – 12:00


Part A


   Answer all questions                                                                              10 x 2 = 20 Marks


  1. Define Non parametric test.
  2. A super market is closed on all Sundays, it is decided to open it on Sundays if atleast 25 % of customer welcome this decision. For that a study is conducted and out of 20 interviewed, 8 responded favourably. Should the market opened on Sundays ?
  3. What is Kolmogrov – Smirnov one sample test ?
  4. What do you meant by sign test ?
  5. Define Wilcoxon signed rank test.
  6. Explain Mann – Whitney U test.
  7. What is run test ? Give an example.
  8. Discuss Wald’s probability ratio test.
  9. Write the mean and variance for Wald Wolfowitz run test.
  10. Define O.C.function.


Part B


Answer any five questions                                                                      5 x 8 = 40 Marks


  1. A survey of 320 families with 5 children each revealed the following
No . of boys 5 4 3 2 1 0
No. of  girls 0 1 2 3 4 5
No. of families 14 56 110 88 40 12


Test whether the male and female births are equally probable.

  1. The following data gives the number of minutes if schedule (X) buses in a city early arrivals be indicated by  – ve values and late arrivals be indicated by +ve values. Examine whether the data ~ N (µ,. Given µ = 1.6 min. and σ = 3,


X -5 -3 -1 0 1 2 4 7 8
f 1 1 2 1 5 5 3 1 1


  1. Write the comparison between Chi square test and Kolmogrov – Smirnov test.
  2. The life time batteries for two brands A and B are given. Examine whether the average life times are equal using median test.
Brand A 40 30 40 45 55 30
Brand B 50 50 45 55 60 40


  1. Explain Mann – Whitney U test.
  2. Two types of finishing gives to 15 pairs of similar modern doors and scores were

given by experts as below.

Finishing A Finishing B
42 44
56 53
57 58
79 67
62 61
64 65
52 51
73 70
75 78
62 63
63 65
71 70
69 67
81 79
84 81


Use Wilcoxon signed rank test to examine if finishing A and finishing B are equal in effect.

  1. Explain sequential probability ratio test.
  2. Obtain the Wald’s SPRT for testing vs  () based on observations from  N (µ, at given strength (α,β) where µ is known


Part C


Answer any two questions                                                                      2 X 20 = 40 Marks


  1. Give the following sequence of observation from mal distribution with σ = 15. Test =135  Vs  =150 by means of SPRT of strength α = .01, β = .03

121  137  144  136  104  151  155  130  160  145  120  140  125  106  145  123  138  108  111  118  129  123  135  149  139 127

Draw the acceptance and rejection lines and draw the o.c. curve and ASN curve.


20.a)  State and prove Wald’s fundamental identity.                                               (12 Marks)


  1. b) Obtain the O.C. function with respect to SPRT for testing Vs

based on a Poisson distribution with parameter λ at strength (α ,β).                         (8 Marks)


  1. a) Explain test of randomness (14 marks)


  1. b) Apply a suitable non – parametric test to decide the randomness of infection if a sequence of healthy and infected plants as follows

H T H H H T T H H H H T T T H T T H H H H H T H T (6 Marks)


  1. a) For the following data arising from two distinct populations . Test for the equality of the probability laws governing the populations using Kolmogrov – Smirnov test.

(10 marks)


Sample 1 Sample 2
25 27
24 31
26 32
21 29
13 41
29 32
30 23
16 28
11 29
18 27
17 26
21 28
22
27
19
32
40
35


  1. b) Two teachers A and B teach the same topic to two sets of students and the scores in the examinations are as follows :


Teacher A Teacher B
81 77
75 63
92 75
78 84
87 85
83 68
94 70
73 73
79 90
82 82
88 62
72 65
81
97
84
67
63
77
84
66


Test the hypothesis that there is no difference in the effectiveness of teaching of the two teachers by using Wicoxon rank sum test. Comment on the result.

(10 Marks)


Go To Main page

© Copyright Entrance India - Engineering and Medical Entrance Exams in India | Website Maintained by Firewall Firm - IT Monteur