Loyola College M.Sc. Statistics April 2012 Sampling Theory Question Paper PDF Download

LOYOLA COLLEGE (AUTONOMOUS), CHENNAI – 600 034

M.Sc. DEGREE EXAMINATION – STATISTICS

SECOND SEMESTER – APRIL 2012

ST 2813 – SAMPLING THEORY


Date : 21-04-2012             Dept. No.                                        Max. : 100 Marks

Time : 9:00 – 12:00


Part A

Answer  all the Questions:                                                                                                     (10 X 2 = 20)


  1. Define mean square error of an estimator T. When does it reduce to variance?
  2. Define first and second order inclusion probabilities.
  3. Suggest an unbiased estimator for population proportion under SRSWOR.
  4. Explain modified systematic sampling.
  5. When ratio estimator is better than the expansion estimator?
  6. Write the formula for nh under Neyman allocation.
  7. Explain cumulative total method.
  8. What is the need for regression estimator?
  9. Let V denote the distinct units drawn in SRSWR. Suggest an unbiased estimator for population mean and  write the variance based on V- distinct units.
  10. Show that is unbiased for y for the populations with linear trend when k is odd.


Part B

Answer any Five questions:                                                                                                  (5 X 8 = 40)


  1. Obtain V[Ii(s)] , Cov [Ii(s), Ij(s)]
  2. Explain Midzuno’s scheme. Specify a method to draw a sample using Midzuno’s scheme and show that it actually implements the scheme.
  3. Obtain the unbiased estimator and its variance for the population total when SRSWOR is used in both the stages of the two-Stage sampling method.
  4. Obtain the bias and mean square error of the regression estimator.
  5. Explain Warner’s method of randomized response method.
  6. Suggest an unbiased estimator for the population total when PPSWR is used in all the strata. Obtain the variance of the estimator and an unbiased estimator of the variance.
  7. Show that unbiasedness depends on the sampling design.
  8. Explain the need for circular systematic sampling and the problems involved.


Part C

Answer any two Questions:                                                                                                 (2 X 20 = 40)


  1. a)  Show that Horvitz – Thompson is unbiased for the population total. Obtain the variance of the estimator in the Yates- Grundy form.
  2. Obtain the variance Of  .

(12 + 8)

  1. a) Show that

Vran ≥ Vprop ≥ Vopt

  1. Explain Balanced systematic sampling. Show that is unbiased and write the variance of the estimator

(12 + 8)

  1. a) Show that Desraj estimator is unbiased in PPSWOR and obtain its variance.
  2. Derive Murthy’s estimator when n=2.

(12 + 8)

  1. a) Obtain the bias of the Jackknife ratio estimator.
  2. Obtain the bias and mean square error of the combined ratio estimator and separate ratio estimator in stratified random sampling. (12 + 8)


Go To Main Page


Loyola College M.Sc. Statistics April 2012 Probability Theory And Stochastic Processes Question Paper PDF Download

LOYOLA COLLEGE (AUTONOMOUS), CHENNAI – 600 034

M.Sc. DEGREE EXAMINATION – STATISTICS

SECOND SEMESTER – APRIL 2012

ST 2902 – PROBABILITY THEORY AND STOCHASTIC PROCESSES


Date : 23-04-2012             Dept. No.                                        Max. : 100 Marks

Time : 1:00 – 4:00


SECTION – A

            Answer All the questions.                                                                 (10 x 2 = 20 Marks)


  1. Let A and B two events on the sample space. If A C B, show that P (A) < P (B)
  2. If P (AÈB) = 0.7 , P(A) = 0.6 and P (B) = 0.5 , find P (AÇB) and P (AcÇB)
  3. Define conditional probability of events.
  4. Define normal distribution.
  5. Define a Renewal process.
  6. If X has the following probability distribution:

X = x:            -3       -2        -1           0          1          2

P (X=x):          1/16     1/2       0         1/4       1/8       1/16

Find E (X).

  1. Let x be a nonnegative random variable of the continuous type with pdf f and let α>0. If Y = Xα , find the pdf of Y.
  2. Compute P (0 < X < 1/2 , 0 < Y < 1)  if  (X , Y) has the joint pdf


f (x , y)       =        x2 + xy/3  ,  0 < x <1 , 0 < y < 2

0               ,  otherwise

  1. Define communication of states of a Markov chain.
  2. Write a note on Martingale.


SECTION – B

            Answer any Five questions.                                                              (5 x 8 = 40 Marks)


  1. State and prove Boole’s inequality.
  2. A problem in statistics was given to 3 students and whose probabilities of solving it are respectively 1/2 , 3/4 and 1/4 . What is the probability that (i) at least one will solve

(ii) exactly two will solve   (iii) all the three will solve if they try independently.

  1. If a random variable X has the pdf f (x) = 3x2 ,  0 ≤ x < 1 , find a and b such that

(i)  P (X ≤ a) = P (X >a) and  (ii) P (X >b) = 0.05.  Also compute P (1/4 < X < 1/2) .

  1. If X has pdf f (x) = k x2 e-x , 0 < x < ∞ , find (i) k     (ii) mean          (iii) variance
  2. Let X be a standard normal variable. Find the pdf of Y = X2.
  3. Explain the following (a) The Renewal function (b) Excess life   (c) Current life

(d) Mean total life


  1. If f (x, y) = 6 x2 y , 0 < x < 1 , 0 < y < 1, find (i) P (0 < X < 3/4 Ç 1/3 < Y < 1/2)

(ii) (P (X < 1 | Y <2)


  1. (a) Prove that communication is an equivalence relation.

(b) Write the three basic properties of period of a state.


SECTION – C

            Answer any Two questions.                                                             (2 x 20 = 40 Marks)


  1. (a) State and prove Bayes’ theorem.

(b) Consider 3 urns with the following composition of marbles.


Urn                     Composition of Marbles

White                 Red                Black


I                     5                      4                      3

II                    4                      6                      5

III                    6                      5                      4

The probabilities of drawing the urns are respectively 1/5, ¼ and 11/20.  One urn was chosen at random and 3 marbles were chosen from it.  They were found to be 2 red 1 black.  What is the probability that the chosen marbles would have come from urn I, urn II or urn III?


  1. (a) If X has the probability mass function as P (X = x) = qxp ; x = 0, 1, 2, . . . . . ; 0 < p < 1 ,

q = 1-p find the MGF of X and hence find mean and variance.


(b)  State and prove Lindeberg – Levy Central Limit Theorem.


  1. Let f (x1 y) = 8xy , 0 < x < y <1 ; 0 , elsewhere be the joint pdf of X and Y. Find the conditional mean and variance of X given Y = y , 0 < y < 1 and Y given x = x , 0< x < 1.


  1. (a) A Markov chain on states {0, 1, 2, 3, 4, 5} has transition probability matrix.


1         0         0         0         0         0

0         3/4       1/4       0         0         0

0         1/8       7/8       0         0         0

1/4       1/4       0         1/8       3/8       0

1/3         0        1/6       1/6       1/3       0

0          0          0          0          0        1


Find all equivalence classes and period of states.  Also check for the recurrence of the

states.


(b) Derive Yule process assuming that X (0) = 1                                                             (10 +10)


Go To Main Page


Loyola College M.Sc. Statistics April 2012 Reliability Theory Question Paper PDF Download

LOYOLA COLLEGE (AUTONOMOUS), CHENNAI – 600 034

M.Sc. DEGREE EXAMINATION – STATISTICS

SECOND SEMESTER – APRIL 2012

ST 2957 – RELIABILITY THEORY


Date : 24-04-2012             Dept. No.                                        Max. : 100 Marks

Time : 9:00 – 12:00

SECTION – A


Answer all the questions                                                                                                             (10×2=20)

  1. Define Reliability R(t) of a system
  2. Define Hazard function r(t)

3.

RA=0.87, RB=0.85, RC=0.89. Determine system reliability

  1. Define Parallel-Series system
  2. Define MTBF
  3. Define a (k,n) system
  4. Define Standby system
  5. R(t) = e– 0.2t determine the warranty period for a reliability of 0.9
  6. An equipment has a hazard function r(t) = 6×10⁻⁸t2. The equipment is required to operate a 100

hours. What is the reliability at 100 hours?

  1. Define a) DFRD b)IFRD


SECTION-B

Answer any five questions                                                                                                          (5X8=40)


  1. Obtain the system reliability function R(t) and hazard function r(t) when the system failure time distribution follows Weibull distribution
  2. Establish the following (3+3+2)
  3. i) ii) If R*(s) = LT{R(t)} then MTBF = R*(0) iii)If T~Exponential distribution then MTBF=1/λ
  4. Obtain system failure time density function for a (k,n) system
  5. Define Series-Parallel system. Obtain system hazard function r(t) and MTBF for a

Series-Parallel System

  1. Consider a series system consisting of two components with first component following a

exponential failure time distribution with λ=1/10,000 and second component following a

weibull with parameters β=6 and η=10,000. i)Obtain system reliability ii)Obtain system’s cdf

and pdf  iii) Given that the system has performed 500 hrs what is the reliability of the system

for an additional 1000hr mission  iv)Obtain the system failure rate v)What should be the

warranty period for a system reliability of 90%

  1. Explain the methods of obtaining the reliability of a Complex system

17 Establish the following

  1. F is IFR ó on [0,∞)
  2. F is IFR ó
  3. i) Establish: r(t) is a conditional probability function but not a conditional pdf
  4. ii) Establish: r(t)↓t ó F is DFRD


SECTION-C


Answer any two questions                                                                                                         (2X20=40)


  1. Obtain the reliability function R(t) and hazard function r(t) for the following failure time

distributions  i) Exponential   ii) Gamma

  1. Obtain MTBF for the case when failure time(T) of a system is distributed as i) Exponential

ii)Weibull  iii) Gamma

  1. Consider a Standby system of order 3 with Ti ~ Exponential(λi), i=1,2,3 . obtain the system

failure time density function and hence obtain the reliability function R(t) for the case when

λ1= λ2= λ3 and λ1≠ λ2≠ λ3(20)

  1. Obtain system mean time between failure (MTBF) for a (k,n) system


Go To Main Page


Loyola College M.Sc. Statistics April 2012 Multivariate Analysis Question Paper PDF Download

LOYOLA COLLEGE (AUTONOMOUS), CHENNAI – 600 034

M.Sc. DEGREE EXAMINATION – STATISTICS

THIRD SEMESTER – APRIL 2012

ST 3811/3808 – MULTIVARIATE ANALYSIS


Date : 21-04-2012             Dept. No.                                        Max. : 100 Marks

Time : 1:00 – 4:00


SECTION – A

Answer ALL the following questions:                                                                            (10 x 2 = 20 marks)

  1. Define var-cov matrix, correlation matrix and standard deviation matrix. State the relationship among them.
  2. State the general expressions for the mean vector and var-cov matrix of linear transformations of a random vector.
  3. State the general form of ‘statistical distance’.
  4. Explain ‘Bubble Plots’.
  5. Define ‘Partial Correlation Coefficient’.
  6. State the one-way MANOVA model.
  7. State the test for significance of correlation coefficient in a bivariate normal population.
  8. Give one reason why in K-means algorithm, the number of clusters ‘K’ is kept an open question.
  9. State the postulates on the ‘common factors’ and the ‘specific factors’ in the orthogonal factor model.
  10. Explain a situation where the ‘challenge’ of ‘Classification’ arises.


SECTION – B

Answer any FIVE questions:                                                                                             (5 x 8 = 40 marks)

  1. Briefly explain the terms ‘Data Reduction / Structural Simplification’ and ‘Sorting / Grouping’. Give real-life examples of these two objectives which are addressed by multivariate methods.


  1. Explain probability plots in general and how it is used for investigation of multivariate normality assumption.


  1. Derive the moment generating function of multivariate normal distribution.
  2. If X =  ~ Np (μ,Σ) and μ and Σ are accordingly partitioned as  and where  ≠ 0, derive the conditional distribution of X(1) given X(2).


  1. Derive Fisher’s linear discriminant function for discriminating two populations.


  1. Mention the three linkage methods for hierarchical clustering and present a figurative display of the measure of between-cluster distances in each method.


  1. Develop the Hotelling’s T2 test through the likelihood ratio criterion.         (P.T.O)
  2. Give the motivation and the formal definition of Principal Components. State the ‘Maximization Lemma’ (without proof) and hence, obtain the PCs for a random vector


SECTION – C

Answer any TWO questions:                                                                                          (2 x 20 = 40 marks)

  1. (a) If and S are the sample mean vector and var-cov matrix from a sample of size ‘n’ from a multivariate population with mean vector μ and var-cov matrix Σ , show that  is an unbiased estimator of μ but Sn is a biased estimator of Σ.

(b) Derive the MLEs of the parameters of multivariate normal distribution.

(10+10)


  1. (a) Consider the partitions in Q.No. (14). Let =  where= ith row of  . Show that, for every vector α,

(i)  Var[ Xi – X(2) ] ≤ Var [ Xi – α′ X(2) ]

(ii) Corr ( Xi, X(2) ) ≥ Corr ( X , α′ X(2) ).

Hence, obtain an expression for the multiple correlation coefficient between Xi and X(2).

(b) Find the mean vector and the var-cov matrix for the bivariate normal distribution whose p.d.f. is

f(x,y) = exp                 (12 + 8)

  1. (a) Exhibit the ‘ambiguity’ in the factor model. Bring out the need for factor  rotation and explain the ‘Varimax’ criterion for rotation.

(b) Explain the ‘Ordinary Least Squares Method’ of estimating the Factor Scores.

(12 + 8)


  1. (a) Derive an expression for ‘Expected Cost of Misclassification (ECM)’ for classification involving two populations and obtain the optimum allocation regions for the ‘Minimum ECM Rule’.

(b) Consider the following table on three binary variables measured on five subjects with a view to carry out clustering of the five subjects:

    variable


Individual


X1              X2               X5

1

2

3

4

5

    0                0                   1

1                1                   1

0                0                   1

0                1                   1

1                1                   0


Obtain the matrices of matches and mismatches, compute the similarity measure

sij =  (under usual notations) and carry out the clustering.         (10 + 10)


Go To Main Page


Loyola College M.Sc. Statistics April 2012 Measure And Probability Question Paper PDF Download

LOYOLA COLLEGE (AUTONOMOUS), CHENNAI – 600 034

M.Sc. DEGREE EXAMINATION – STATISTICS

FIRST SEMESTER – APRIL 2012

ST 1814/1809 – MEASURE AND PROBABILITY


Date : 25-04-2012             Dept. No.                                        Max. : 100 Marks

Time : 9:00 – 12:00


SECTION – A

Answer all the questions                                                                                                       (10×2=20)

  1. Define Increasing and Decreasing sequence of sets
  2. Define Field
  3. Define Monotone class
  4. Define Borel σ-field
  5. Define Measure
  6. Define Random variable
  7. State Chebyshev’s Inequality
  8. State Minkowski’s Inequality
  9. Establish: E[log(X)]≤log[E(X)]
  10. Define Convergence in Distribution

SECTION B

Answer any five questions                                                                                                    (5×8=40)

  1. i) Establish: If A1,A2,A3,. . . , An be subsets of Ω, then
  2. ii) If {An, n ≥1} is an increasing sequence of subsets of Ω then
  3. State and Establish Cauchy-Schwartz Inequality
  4. Establish: Every σ-field is a field but the converse is not true
  5. Establish: If and   then
  6. Prove by an Example: X2 and Y2 are independent need not imply X and Y are independent
  7. i) Establish: If E[h(X)] exist then E[h(X)] = E[E{h(X)|y}]                                      (6)
  8. ii) Define Jenson’s Inequality (2)


  1. Find the density function of a distribution whose characteristic function is given below
  2. State Lindeberg-Feller Central limit theorem and hence prove Liapounov’s Central Limit therorem

SECTION C

Answer any two questions                                                                                              (2×20=40)

  1. State and prove Basic Integration theorem
  2. i) State and Prove Monotone Convergence Theorem                                                             (10)
  3. ii) The Minimal σ-field generated by the class of all open intervals is a Borel σ-field         (10)
  4. i)  State and Establish Minkowski’s Inequality                                                                     (10)
  5. ii) Let µ be a finitely additive set function on a field F of subsets of Ω. Further let µ is

continuous from above at Φ F    , then µ is countably additive on F                                       (10)

  1. i) State and prove Inversion theorem  on characteristic function                                         (10)
  2. ii) State and Establish Lindeberg-Levy Central limit theorem                                                              (10)


Go To Main Page


Loyola College M.Sc. Statistics April 2012 Bio-Statistics Question Paper PDF Download

LOYOLA COLLEGE (AUTONOMOUS), CHENNAI – 600 034

M.Sc. DEGREE EXAMINATION – STATISTICS

SECOND SEMESTER – APRIL 2012

ST 2960 – BIO-STATISTICS


Date : 24-04-2012             Dept. No.                                        Max. : 100 Marks

Time : 9:00 – 12:00


SECTION – A

Answer ALL the questions                                                                                 (10 x 2 = 20 marks)

  1. Mention the broad types of observational studies.
  2. Explain the term ‘Concurrent Control’ in Clinical Trials.
  3. State the need for adjusting rates.
  4. Explain the term ‘Prevalence’ of a disease.
  5. State the use of Kappa statistic and give its form.
  6. Name the two tests used to test equality of means when the same group is measured twice.
  7. Express ‘baseline category logit’ in terms of ‘adjacent-categories logits’.
  8. Write the link equation for the ‘proportional odds cumulative logit model.
  9. State the difference between Actuarial Analysis and  Kaplan- Meier Method  in survival data

Analysis.

  1. Give the estimate for ‘Hazard Rate’ when survival distribution is exponential.


SECTION – B

Answer any FIVE questions                                                                                 (5 x 8 = 40 marks)

  1. Describe the different ‘Scales of Measurement’ with examples.
  2. The following two-way table is obtained from an experiment conducted to study the effect of

a drug ‘A’ in reducing the risk of a disease:

                        Outcome

Risk factor

Disease No Disease Total
Drug ‘A’ 71 5448 5519
Placebo 119 5395 5514
190 10843 11033


Compute  Experimental Event Rate,  Control Event Rate,  Relative Risk  and   Absolute Risk

Reduction and interpret the results.

  1. Investigators wished to know if  there was  a significantly  higher Insulin  sensitivity among

people with normal weight compared to overweight people. The following measurements on

insulin sensitivity were obtained from 11 normal-weight people and 8 overweight people:

Normal-Weight subjects: 0.97, 0.88, 0.66, 0.52, 0.38, 0.71, 0.46, 0.29, 0.68, 0.96, 0.97

Overweight subjects: 0.76, 0.44, 0.48, 0.39, 1.10, 0.19, 0.19, 0.19

Carry out Wilcoxon Rank Sum Test and draw your conclusions.

(Cont’d)

  1. A medical initiative was started in a certain locality two years ago. Among 300 people in the

locality, 178 supported  the initiative at  the start of  the program but at present the number of

people supporting it is 142. And among the original supporters only 96 continue their support

now while the remaining are opposing it. Form the contingency table to apply McNemar Test

and draw the appropriate conclusion.

  1. Discuss the two approaches to compare proportions in two groups.
  2. Apply the Levene Test to compare the variances of the two populations (of normal-weight

subjects and overweight subjects) based on the sample observations given in Q. No. (13).

  1. Discuss the baseline category logit model for nominal multinomial response variable. Obtain

estimates for probabilities of membership of an individual to the various response categories.

  1. For the data in Q.No. (22) apply the Actuarial Method to estimate the survival function for

patients under Therapy ‘B’, considering time-windows of 180 days.


SECTION – C

Answer any TWO questions                                                                              (2 x 20 = 40 marks)

  1. Describe ‘Cohort Studies’, ‘Historical Cohort Studies’ and ‘Clinical Trials with Cross Over’.

Present schematic diagram for each of these designs.


  1. (a) The following table gives the data on infant deaths observed in three regions over a time-

period:

.                                         Region A                              Region B                             Region C                      .

.       Birthweight           Births          Deaths            Births           Deaths           Births          Deaths

.                                  (in 1000.s)                           (in 1000’s)                           (in 1000s)                          .

< 1500 g                   30                1280                 60               3605                 40               5020

1500-2499 g              45                  710                 90                1780                70               1960

≥ 2500 g                   225                1540               130                1155             110               1220        .

Total                         300                3530               280                6540              220               8200       .

Find the ‘Crude Infant Mortality  Rate’ for each region.  Compute ‘Adjusted Infant Mortality

Rates’  by  direct  method for Regions B and C  treating  Region A  as  reference population.

Supposing that the  Age-Group-Wise  ‘Specific Infant  Mortality  Rates’  for B and C  are  not

available, find  ‘Standardized Infant Mortality Ratios’  for  these two  regions again  keeping

A as the reference population.

(b) Explain the Large Sample Sign Test.                                                                         (12 + 8)


  1. The condition of patients brought to the head-injury unit of a hospital are classified into

four categories:

1 – mild injury (not requiring hospitalization)

2 – moderate injury (requiring hospitalisation)

3 – severe injury (requiring intensive care)

4 – very severe injury (resulting in ‘coma’ state / death)                                           (Cont’d)

A continuation-ratio logit model was built based on past data collected from the hospital

and the following logit equations were obtained:

Log = –0.004 + 0.058*age – 0.003*BP + 0.128*DH – 0.573*DR – 1.14* D2w – 0.532*DBlood

Log  = 0.009 + 0.074*age – 0.014*BP + 0.421*DH – 0.718*DR – 0.92* D2W – 0.612* DBlood

Log  = 0.022 +  0.082*age – 0.037*BP + 0.613*DH – 0.838*DR –  0.23*D2W – 0.751*DBlood

where DH  indicates  injury at  home, DR   indicates  injury while walking  on the  road, D2W

indicates injury while riding two-wheeler and  DBlood indicates the patient was bleeding. BP

is the systolic blood pressure measured at the time of being brought to hospital.

Estimate the probabilities for a 45 year old man, bleeding, with BP = 140 who was  injured

while on two- wheeler to be classified into each of the four injured categories.


  1. Patients with prostate carcinoma (tumour) are subject to two types of therapy (A and B). The

interest among investigators  is  on  the  ‘survival time’ of  the patients.  Data on 20 patients

observed for a maximum period of 5 years are given below:

Patient Days in study Therapy Outcome
Name

Name

Name

Name

Name


Name

Name

Name

Name

Name


Name

Name

Name

Name

Name


Name

Name

Name

Name

Name

97

159

213

255

303


425

494

620

715

760


895

930

1007

1102

1163


1304

1413

1490

1595

1676

A

B

A

A

B


B

B

A

B

A


B

A

B

B

A


A

A

A

A

A

Dead

Dead

Dead

Alive

Alive


Alive

Alive

Dead

Alive

Alive


Alive

Alive

Dead

Alive

Dead


Alive

Dead

Alive

Alive

Dead

Apply the Logrank test to compare the survival distributions of patients under the two therapies.


Go To Main Page



Loyola College M.Sc. Statistics April 2012 Estimation Theory Question Paper PDF Download

LOYOLA COLLEGE (AUTONOMOUS), CHENNAI – 600 034

M.Sc. DEGREE EXAMINATION – STATISTICS

SECOND SEMESTER – APRIL 2012

ST 2811 / 2808 – ESTIMATION THEORY


Date : 17-04-2012             Dept. No.                                        Max. : 100 Marks

Time : 9:00 – 12:00

SECTION – A

Answer all the Questions:                                                                                              (2×10=20 Marks)

  1. State the Methods of Obtaining UMVUE
  2. State the Invariance Property of MLE
  3. State Neyman-Fisher Factorization Theorem
  4. Provide an example to prove that an unbiased estimator need not be unique
  5. Define Sufficient Statistic and Provide an Example
  6. Define Bayesian Estimator
  7. State the use of Rao-Blackwell Theorem
  8. Define T-Optimality
  9. Provide the large sample behavior of Maximum Likelihood Estimator
  10. Define Best Linear Unbiased Estimator

SECTION – B

Answer any Five Questions:                                                                                     (5×8=40 Marks)

  1. State and Prove the necessary and sufficient condition for unbiased estimator to be UMVUE
  2. State and Prove Cramer-Rao Inequality for Multi-parameter case and hence

establish the inequality for the case of single parameter

  1. State and Prove Neyman-Fisher Factorization theorem
  2. Let X1,X2,…,Xn be a random sample of size n from uniform distribution U(0,θ),

Y=max{ X1,X2,…,Xn} show that is an Unbiased Estimator of θβ. Where β is a

positive constant


  1. State and Prove Rao-Blackwell Theorem.
  2. Let Y1,Y2,Y3,Y4 be random variable with E(Y1) = E(Y2)= θ1+ θ2 , E(Y3) = E(Y2)= θ1+ θ3 determine the estimability of the following linear parametric functions
  3. i) 2θ1+ θ2+ θ3 ii)  θ32         iii)  θ1         iv)  3θ1+ θ2+2 θ3
  4. Let X1,X2,…,Xn be a random sample of size n from N(μ,σ2) obtain (1-α)%

confidence interval for σ2 using the large sample behavior of MLE

  1. Find the Bayes Estimator of parameter p of a Binomial Distribution with X successes

out of n trials given that the prior distribution of p is a Beta distribution with

parameter α and β.


SECTION – C

Answer any two questions:                                                                                           (2×20=40Marks)


  1. i. Establish: If UMVUE exists for a parametric function , It must be essentially

unique.

  1. Obtain UMVUE of θ(1-θ) using a random sample of size n from B(1,θ).


  1. Let X1,X2,…,Xn be a random sample from N(µ,σ2). Find Cramer-Rao lower bound for

estimating   a) µ        b) σ2       c) µ+ σ       d)

  1. Define Consistent Estimator and Establish the sufficient condition for Consistency.


  1. Establish: δ*Ug is QA-Optimal if and only if each component of δ* is UMVUE.


  1. Let X1,X2,…,Xn be a random sample from N(μ,σ2),μR, σ2>0. Obtain MLE of (μ,σ2)
  2. Explain Bootstrap and Jackknife Methods.


Go To Main Page


Loyola College M.Sc. Statistics April 2012 Applied Experimental Design Question Paper PDF Download

LOYOLA COLLEGE (AUTONOMOUS), CHENNAI – 600 034

M.Sc. DEGREE EXAMINATION – STATISTICS

FOURTH SEMESTER – APRIL 2012

ST 4809 / 4805 – APPLIED EXPERIMENTAL DESIGN


Date : 16-04-2012             Dept. No.                                        Max. : 100 Marks

Time : 1:00 – 4:00


SECTION – A

Answer all the questions:                                                                                            (10 x 2  = 20 marks)


  1. Define fixed effect model with an example.
  1. List the principles of experimental design.
  1. Define orthogonal contrasts with suitable illustration.
  2. State the model used in LSD.
  3. State the power cycle  for 32 factorial design.
  4. Briefly explain the term sub-plot treatments.
  5. Define the term Simple Lattice with an example .
  6. State the parametric conditions of a BIBD.
  7. Give any two advantages of confounding.
  8. What is meant by surfaces ?


SECTION-B


Answer any Five questions:                                                                                            (5 x 8  = 40 marks)


  1. Explain how you would analyse a randomized block design.
  2. Describe, the analysis of variance for a 25 factorial design, stating all the

hypothesis, ANOVA and conclusions

  1. Discuss in detail fractional(half) factorial design with suitable illustration.
  2. Describe the analysis of completely confounded 24 factorial design in which the highest order

interaction is confounded stating all the  hypothesis, Anova and conclusions.

  1. Discus in detail the importance and the analysis of a SPLIT-Plot design.
  2. Construct a Youden Square, when the number of treatments is equal to seven.
  3. Distinguish between RBD and BIBD with suitable illustration.
  4. Explain the term key block with an example.


SECTION-C


Answer any Two questions:                                                                                         (2 x 20  = 40 marks)


19.a) Describe, the analysis of  variance for a 32 factorial design, stating all the

hypothesis, anova and conclusions.

b)Construct Mutually orthogonal Latin squares (MOLS), when the number of treatments is equal to

five.                                                                                                                                 (10+10 Marks)


  1. a) Explain the the method of Steepest ascent, with neat diagram.
  2. b) Discuss the first order and second order response surface designs.(8+12 Marks)


  1. a) Construct a PBIBD with 3 associate classes stating all the parametric conditions
  2. b) Explain the Group divisible design. (12+8-Marks)


22 Write shorts on the following

  1. Incomplete block design
  2. Replication
  3. Industrial applications of experimental designs
  4. FERMAT’S theorem. (5+5+5+5-Marks)


Go To Main Page


Loyola College M.Sc. Statistics Nov 2012 Testing Statistical Hypotheses Question Paper PDF Download

LOYOLA COLLEGE (AUTONOMOUS), CHENNAI – 600 034      LOYOLA COLLEGE (AUTONOMOUS), CHENNAI – 600 034    M.Sc. DEGREE EXAMINATION – STATISTICSSECOND SEMESTER – NOVEMBER 2012ST 2812 – TESTING STATISTICAL HYPOTHESES
Date : 03/11/2012 Dept. No.   Max. : 100 Marks    Time : 1:00 – 4:00
SECTION – A
Answer  ALL  questions.  Each  carries TWO  marks:      (10 x 2 =  20 marks)
1.   Discuss the objective of Statistical Inference.
2.   Explain Interval Estimation as an infinite decision problem with many possible correct       decisions.
3.  Give the mathematical formulation of symmetry or invariance.
4.   Describe minimax procedure.
5.   Distinguish between size and level of significance of a test.
6.   Show that one parameter exponential family possesses MLR property.
7.   Define Similar test.
8.   State Generalized Neyman-Pearson Theorem.
9.   When do we say function is Maximal Invariant?
10.  Define likelihood ratio test statistic and state the test criterion.
SECTION – B
Answer any FIVE questions.  Each carries EIGHT marks:      (5 x 8 = 40 marks)
11.  Let β denote the power of a most powerful test of level α for testing simple hypothesis H       against simple alternative K.  Prove that  (i) β  ≥  α   (ii) α < β unless p0 = p1.
12.  Let X1, … , Xn be a random sample from N(μ, σ2), where σ2 is known.  Derive UMPT       of  level α for testing H: μ ≤ μ0 versus K: μ > μ0.
13.  Let ‘T’ denote the time required to get ‘r’ events in an inverse Poisson sampling with        process average rate λ.  Show that the minimum number of events to be observed is       r = 14 in order to get a power greater than 0.8 at λ = 1.5 in a UMPT of level α = 0.05       for testing H: λ ≤ 0.5 versus K: λ > 0.5.

14.  Obtain the UMPUT for H: λ = λ0 versus K: λ ≠ λ0 in the case of Poisson distribution        and deduce the ‘side conditions’ that are required to be satisfied.
15.  If X ~ B(m, p1) and Y ~ B(n, p2) and are independent,  then compare the two Binomial       populations using UMPUT for H: p1 ≤ p2 versus K: p1 > p2.
16.  If the power function of every test function is continuous in θ, then show that any unbiased        test  is similar on the boundary.
17.  Define unbiased test and UMP test.  Hence if there exists UMPT of level α for testing a            composite H against a composite K, then show that it is unbiased.
18.  Explain locally most powerful unbiased level α test with an example.
SECTION – C
Answer  any TWO  questions.  Each  carries TWENTY  marks.     ( 2 x 20 =  40 marks)
19.  Let X ~ Pθ with MLR in T(x).  Establish the existence of UMPT for H: θ ≤ θ0 versus       K: θ > θ0 and obtain its form. β  (θ)  Show that its power β  (θ) strictly increases for all θ       for which o <  β  (θ) < 1.  Also show that the test minimizes β  (θ)  θ < θ0.
20.  Let X1, … , Xn be a random sample from U(0, θ), θ > 0.  For testing H: θ ≤ θ0 versus       K: θ > θ0, show that there exists more than one UMPT.  In the same problem, obtain       UMPT for H: θ ≥ θ0 versus K: θ < θ0.
21.  Let X1, … , Xn be a random sample from E(a, b) where both ‘a’ and ‘b’  are unknown.       Using the test statistic T = U / V, where  U = X(1)  –  a0 and  V =  ,        obtain the power function of the level α  test                                   = {█(1  when T  ≤C_1@ 0  otherwise       )┤
for testing  H: a = a0 versus KL: a < a0.  Also obtain the power function of the level α test
= {█(1  when T  ≥C_2@ 0  otherwise       )┤
for testing  H: a = a0 versus KR: a > a0.
22(a) Let X1, … , Xn be a random sample from N(μ, σ2), with both parameters unknown.         Derive the LRT of level α for testing H: σ2 = σ_0^2 versus K: σ2 ≠ σ_0^2.              (10)        (b) Consider the test for H: θ = θ0 versus K: θ ≠ θ0 based on a random sample of  size ‘n’          from a distribution in the Cramer family.  Derive the  asymptotic null distribution of           the  LRT statistic.


Go To Main Page

Loyola College M.Sc. Statistics April 2012 Advanced Operations Research Question Paper PDF Download

LOYOLA COLLEGE (AUTONOMOUS), CHENNAI – 600 034

M.Sc. DEGREE EXAMINATION – STATISTICS

FOURTH SEMESTER – APRIL 2012

ST 4811 – ADVANCED OPERATIONS RESEARCH


Date : 20-04-2012             Dept. No.                                        Max. : 100 Marks

Time : 1:00 – 4:00


PART-A

Answer all the following:                                                                                                            (10X2=20)


  1. When is a solution to an LPP called infeasible?
  2. Define Pure Integer Programming Problem.
  3. Define holding costs.
  4. Write down the basic components of a queuing model.
  5. Write down the significance of integer programming problem.
  6. What do you mean by Non Linear Programming Problem?
  7. Define Dynamic Programming Problems.
  8. Define Stochastic programming.
  9. Provide any two applications for parallel and sequence service systems.
  10. An oil engine manufacturer purchases lubricants at the rate of Rs.42 per piece from a vendor.

The requirement of these lubricants is 1,800 per year. What should be the order quantity per

order, if the cost per placement of an order is Rs.16 and inventory carrying charge per rupee per

year is only 20 paise.


PART  B

Answer any FIVE of the following:                                                                                       (5 X 8 = 40)


11) Use the graphical method to solve the following LPP:

Minimize Z = x1 + 0.5x2

Subject to the constraints:

3x1 +  2x2 ≤ 12 , 5x1≤ 10  x1+ x2 ≥ 8 , – x1+ x2 ≥ 4 ,  x1≥ 0 and x2 ≥ 0.

  • Write down the simplex algorithm.
  • Use duality to solve the following LPP:

Maximize Z = 2x1 + x2

Subject to the constraints:

x1 + 2x2 ≤ 10  ,   x1 + x2 ≤ 6 ,  x1 – x2 ≤ 2 , x1 – 2x­2 ≤ 1 ; x1,x2 ≥ 0 .

  • Write briefly about inventory management.
  • Explain Branch and Bound model for solving interger programming problem.
  • Write Wolfe’s algorithm to solve Quadratic Programming Problem.
  • Solve the following NLPP using lagrangian multiplier principle:

Z =  x2 + y2 + z2

Subject to the constraints:  x + y + z = 1 , x, y , z ≥ 0

  • Explain the scope of simulation and its applications.


PART – C

 Answer any two questions:                                                                                             (2x 20 = 40)


19.(a) Use two-phase simplex method to

Maximize Z =  5x1 – 4x2 + 3x3

Subject to the constraints:

2x1 + x2 -6x3 = 20 , 6x1 + 5x2 + 10x3 ≤ 76 , 8x1 – 3x2 +6x3 ≤ 50 ; x1, x2, x≥ 0

(b) Explain the characteristics of dynamic programming problem.             (12 + 8 )


20) Solve the following integer programming problem using Gomory’s constraints method:

Maximise Z = 7x1+ 9x2

Subject to –x1 + 3x2 ≤ 6, 7x­1+ x2 ≤ 35, x1 is a n integer and x2 ≥ 0

(20)

21)   Use Wolfe’s method to solve the following QPP:

Maximize Z = 4x1 + 6x2 – 2x1x2 – 2x12 – 2x22

Subject to the constraints:

x1 + 2x2 ≤ 2  ; x1, x2 ≥ 0 .                                                                     (20)


22) a) Derive the steady state differential equation for the model (M/M/1) : (GD/. (12)


  1. b) The rate of arrival of customers at a public telephone booth follows Poisson distribution,

with an average time of 10 minutes between one customer and the next. The duration of a

phone call is assumed to follow exponential distribution, with mean time of 3 minutes.

  • What is the probability that a person arriving at the booth will have to wait?
  • What is the average length of the non-empty queues that form from time to time?
  • The Steve Telephone Nigam Ltd. will install a second booth when it is convinced that the customer would expect waiting for atleast 3 minutes for their turn to make a call. By how much time should the flow of customers increase in order to justify a second booth?
  • Estimate the fraction of a day that the phone will be in use.    (8)


Go To Main Page


Loyola College M.Sc. Statistics Nov 2012 Stochastic Processes Question Paper PDF Download

LOYOLA COLLEGE (AUTONOMOUS), CHENNAI – 600 034

M.Sc. DEGREE EXAMINATION – STATISTICS

THIRD SEMESTER – NOVEMBER 2012

ST 3812 – STOCHASTIC PROCESSES


Date : 03/11/2012            Dept. No.                                        Max. : 100 Marks

Time : 9:00 – 12:00


SECTION – A

Answer all the questions:                                                                                          (10 x 2 = 20 Marks)


  1. Define a point process.
  2. Define n step transition probability.
  3. Write any two basic properties of the period of a state.
  4. If i « j and if i is recurrent then show that j is also recurrent.
  5. Define mean recurrence time.
  6. What is the infinitesimal generator of a birth and death process?
  7. Define excess life and current life of a renewal process.
  8. Define a sub martingale.
  9. Write down the postulates of a birth and death process.
  10. Write down any two examples for stationary process.


SECTION – B

Answer any Five questions:                                                                                     (5 x 8 = 40 Marks)


  1. Explain (i) process with stationary independent increments (ii) Markov processes.
  2. Explain spatially homogenous Markov chains.
  3. Prove that a state i is recurrent if an only if

å  Piin  =  ∞

  1. For a two dimensional random walk, prove that å  P00n  =  ∞
  2. Determine stationary probability distribution for a random walk whose transition probability matrix is


0          1          0          0     . . .

q1         0          p1         0     . . .

0          q2         0          p2   . . .

P  =      .

.

.


-2-


  1. Derive Pn (t) for a Poisson process.
  2. Derive the expected value of a birth and death process with linear growth and immigration.
  3. State and prove the basic renewal theorem.


SECTION – C

Answer any two questions:                                                                                      (2 x 20 = 40 Marks)


  1. (a) State and prove the basic limit theorem of Markov chains.

(b)  Explain discrete renewal equation.                                                           (15 + 5)


  1. (a) Derive the differential equations for a pure birth process.

(b)  Derive the Kolmogorov forward and backward differential equations of a birth and

death process.                                                                                          (10 +10)


  1. (a) Explain renewal function, excess life, current life and mean total life.

(b)  If {Xt}is a renewal process with μ = E [Xt] < ∞ , then show that

lim 1/t M (t) = 1/μ  as t ® ∞                                                                   (8 + 12)

  1. (a) Show that π is the smallest positive root of the equation j(s) = s

for a branching process.

(b)  Compute expectation and variance of branching process.                       (10 + 10)


Go To Main Page


Loyola College M.Sc. Statistics Nov 2012 Statistics For Economists Question Paper PDF Download

LOYOLA COLLEGE (AUTONOMOUS), CHENNAI – 600 034

M.Sc. DEGREE EXAMINATION – STATISTICS

THIRD SEMESTER – NOVEMBER 2012

ST 3902 – STATISTICS FOR  ECONOMISTS


Date : 10/11/2012            Dept. No.                                        Max. : 100 Marks

Time : 9:00 – 12:00


SECTION- A


Answer ALL the following:                                                                                                  (2 X 10 = 20)


1) State any two measures of central tendency.

2) Give the formula for rank correlation coefficient.

3) Define independent events.

4) What are the parameters of normal distribution?

5) Define probability of type II error.

6) What is the test statistic for equality of means in large sample test?

7) Write the four components of time series.

8) Give the formula for Fisher’s ideal index number.

9) Define Optimal solution of an Linear Programming Problem.

10) State any two method of obtaining I.B.F.S of a transportation problem.


SECTION- B

Answer any FIVE of the following:                                                                                         (5 X 8 = 40)


11) Find the mean deviation about mean for the following data given below.


Marks 20-30 30-40 40-50 50-60 60-70 70-80 80-90 90-100
No. of students 3 8 9 15 20 13 8 4


12) Find the coefficient of correlation between X and Y for the following data:

X 10 12 13 16 17 20 25
Y 19 22 26 27 29 33 37


13) Five men in a company of 20 are graduates. If 3 are picked out from this 20 persons

random, what is the probability that (i) all are graduates (ii) exactly 2 are graduates and (iii)

atleast one is a graduate.


14) A random variable X has the following probability function.

x 0 1 2 3 4 5 6 7
p(x) 0 m 2m 2m 3m m2 2m2 7m2+m

(i)Find the value m (ii) Evaluate (a) p( X < 6 ) (b) p( X ≥ 6) (c) p( 0 < X < 5 )


15) Number of road accidents during a month follows Poisson distribution with mean 6. Find the

probability that in a certain month number of accidents will be (i) not more than 3, (ii)

between 2 and 4 and (iii) exactly 5?


16) The customer accounts of a certain departmental store have an average balance of Rs.120

and a standard deviation of Rs. 40. Assuming that the account balances are normally

distributed, find what proportion of accounts is (i) over Rs.150, (ii) between Rs.100 and

Rs.150 and (iii) between Rs.60 and  Rs.90?


17) From the following data, calculate price index numbers for 2011 with 2008 as base year by:

(i) Laspeyre’s method, (ii) Paasche’s method and (iii) Fisher’s ideal method


2008 2011
Commodity Price Quantity Price Quantity
A 20 10 40 10
B 50 12 60 5
C 40 10 50 10
D 20 20 20 25


18) Suggest optimal assignment of the workers to jobs if the completion time (in hours) of

different jobs by different workers is as given below:

Tasks

Men I II III IV
Zico 8 7 9 10
Jay 7 9 9 8
Muthu 10 8 7 11
Febin 10 6 8 7


SECTION – C


Answer any TWO  of the following:                                                                                   ( 2 X 20 = 40)


19) (i) Find the regression line of Y on X for the following data:

X 65 66 67 67 69 71 72 70 65
Y 67 68 69 68 70 70 69 70 70


(ii) Find the standard deviation for the following data given below:

Class 10-15 15-20 20-25 25-30 30-35 35-40
Frequency 2 8 20 35 20 15


20) (i) Three urns are given. Urn 1 contains 2 white, 3 black and 4 res balls, urn 2 contains 3

white, 2 black and 2 red balls and urn 3 contains 4 white, 4 black and 1 red ball. One urn

is chosen at random and two balls are drawn from the urn. If the balls happen to be white

and red, what is the probability that they were drawn from urn 3?

(ii) If 10% of the screws produced by an automatic machine are defective, find the

probability that of 20 screws selected at random, there are (i) exactly two defectives, (ii)

at the most 3 defectives and (iii) between one and four defectives. Find the mean and

variance of the number of defective screws?


21)  (i) 10 Accountants were given intensive coaching and four tests were conducted in a month.

The scores of tests 1 and 4 are given below:

S.NO. 1 2 3 4 5 6 7 8 9 10
Marks in I test 50 42 51 42 60 41 70 55 62 38
Marks in IV test 62 40 61 52 68 51 64 63 72 50

Does the score from test I to test IV show an improvement?

(ii) A random sample of 200 tins of coconut oil gave an average weight of 4.95 kgs with a

standard deviation of 0.21 kgs. Do we accept the hypothesis of net weight 5 kgs per tin at

1% level?                                                                                                    (12+8)


22) (i) Using the three year and five year moving averages determine the trend for the following

data:


Year 2001 2002 2003 2004 2005 2006 2007 2008 2009 2010
Sales

(‘000 Rupees)

21 22 23 25 24 22 25 26 27 26


(ii) Determine an initial basic feasible solution to the following transportation problem using

the Vogel’s approximation method.

Distribution centres

Factory Mumbai Bangalore Delhi Chennai Available
Kolkatta 20 22 17 4 120
Cochin 24 37 9 7 70
Ranchi 32 37 20 15 50
Requirement 60 40 30 110


(10+10)


Go To Main Page


Loyola College M.Sc. Statistics Nov 2012 Statistical Computing – II Question Paper PDF Download

LOYOLA COLLEGE (AUTONOMOUS), CHENNAI – 600 034

M.Sc. DEGREE EXAMINATION – STATISTICS

THIRD SEMESTER – NOVEMBER 2012

ST 3814 – STATISTICAL COMPUTING – II


Date : 06/11/2012            Dept. No.                                        Max. : 100 Marks

Time : 9:00 – 12:00

Answer any THREE questions:

All carry equal marks          


  1. From the following transition probability matrix,

0        1      2        3        4     5


  1. State the state space
  2. Find the equivalence class
  • Find the states which are recurrent or transient
  1. Determine the periodicity of the states
  2. Find the stationary distribution


  1. Suresh has scored 97% in an entrance exam. It is decided to estimate the number of candidates who have scored more than Mr.Suresh. The marks scored by the candidates are displayed in 5 boards. The following is the relevant data,


Board No No.Of Candidates
1 30
2 15
3 20
4 25
5 10

Guided by the contents of the boards it is decided to use the sampling design,


Estimate the number of candidates who have scored more than Mr. Suresh and also compute the estimated variance of the estimate assuming the set {1,3,5} is the sampled set. Find the true variance of the estimator.


  1. a). The data  below are obtained from a small artificial population which exhibits a fairly study raising trend. Each column represents a Systematic sample and the rows are the strata. Compare the precision of Systematic sampling, Simple random sampling and Stratified sampling.
Systematic Sampling Number
Strata 1 2 3 4 5 6 7 8 9 10
I 28 32 33 33 35 34 37 39 40 40
II 15 16 17 17 21 20 22 25 26 24
III 2 3 3 4 7 6 9 9 10 8
IV 5 7 8 9 12 11 14 15 15 16

(17 M)


b).        A sample of 40 students is to drawn from a population of two hundred students belonging

to A&B localities. The mean & standard deviation and their heights are given below


Locality

Total No.Of People Mean (Inches) S.D(Inches)
A 150 53.5 5.4
 

B

             50 62.5 6.2
  1. Draw a sample for each locality using proportional allocation
  2. Obtain the variance of the estimate of the population mean under proportional allocation.

(16 M)


  1. a) If X1 and X2 be 2 observations from f ( x, θ )= θ Xa-1 ,0 < X < 1. To test  H0 : θ = 1 Vs H1 : θ = 2, the critical region in C = {(X1, X2 )|3/4x1 < x2 } . Find the significance level and power of the test. Draw the power curve.                                                                                                (18 M)


  1. b) Let X ~ B ( 1, θ ); θ = 0.1, 0.2, 0.3. Examine if UMP level 0.05 test exist for H : θ = 0.1 Vs K : θ = 0.2, 0.3. (15 M)


  1. Perspiration from 20 healthy females were analyzed. Three components X1 = Sweat rate , X2 = Sodium content  and X3 = Potassium  content  were measured and the results are given below:


Individual           X1                 X2                     X3

1                   3.8                48.6                  9.4

2                5.8                   65.2                 8.1

3                  3.9                       47.3                 11.0

4                  3.3                       53.3                 12.1

5                 3.2                       55.6                  9.8

6                 4.7                       37.1                  8.0

7                 2.5                       24.9                 14.1

8                            7.3                       33.2                  7.7

9                 6.8                       47.5                  8.6

10                 5.5                      54.2                11.4

11               4.0                   37.0              12.8

12               4.6                   58.9              12.4

13               3.6                   27.9                9.9

14               4.6                   40.3                8.5

15               1.6                   13.6              10.2

16               8.6                   56.5                7.2

17               4.6                   71.7                8.3

18                           6.6                   52.9             11.0

19               4.2                   44.2             11.3

20               5.6                   41.0               9.5


Test  the hypothesis  H0 : µ´  = [ 6  ,  52  , 12 ]  against H1 : µ´  ≠ [ 6  ,  52  , 12 ]  at 1% level of

significance.


Go To Main Page


Loyola College M.Sc. Statistics Nov 2012 Multivariate Analysis Question Paper PDF Download

LOYOLA COLLEGE (AUTONOMOUS), CHENNAI – 600 034

M.Sc. DEGREE EXAMINATION – STATISTICS

THIRD SEMESTER – NOVEMBER 2012

ST 3811 – MULTIVARIATE ANALYSIS


Date : 01/11/2012            Dept. No.                                        Max. : 100 Marks

Time : 9:00 – 12:00

SECTION – A

Answer ALL the following questions:                                                                             (10 x 2 = 20 marks)


  1. Distinguish between ‘Data Exploration’ and ‘Confirmatory Analysis’.
  2. Define Variance-Covariance matrix and Generalized Variance of a random vector.
  3. Give the motivation for ‘Statistical Distance’ and express its form.
  4. Define ‘partial correlation coefficient’ and give the expression for it in a trivariate normal distribution.
  5. Explain the objectives of Principal Component Analysis.
  6. Explain the ‘Varimax’ criterion for factor rotation.
  7. Distinguish between ‘Agglomerative’ and ‘Divisive’ methods in clustering.
  8. Present the decomposition of the total sum of squares and cross products in one way MANOVA.
  9. State the test for significance of correlation coefficient in a bivariate normal population.
  10. Define Wishart distribution.


SECTION – B

Answer any FIVE Questions                                                                                              (5 x 8 = 40 marks)


  1. Find the mean vector and var-cov matrix of X = (X, Y) whose p.d.f. is

f (x , y) =

  1. Describe p-p plot and q-q plot and state how the multivariate normality assumption is verified.
  2. Let X = ~ Np (μ,Σ) and μ and Σ be correspondingly partitioned as  and ,  Xi be the ith component of X(1) and let β = σ(i)  where σ(i) is the ith row of . Derive an expression for multiple correlation coefficient between Xi and X(2).
  3. Derive the moment generating function of multivariate normal distribution.
  4. Derive the T2 test for hypothesis concerning the mean vector of a multivariate normal population using the likelihood ratio criterion.
  5. Define Principal Components and extract the same for a given random vector, stating the lemma on maximization of quadratic forms (without proof).
  6. Present Fisher’s method of discriminating two populations and derive the linear discriminant function. Explain the classification rule based on it.
  7. Describe Hierarchical clustering of objects and its algorithm giving figurative depiction of three linkage methods.


SECTION – C

Answer any TWO Questions:                                                                                           (2 x 20 = 40 marks)


  1. (a) Explain the ‘lowess’ curve enhancement of a scatter plot.

(b) Consider the partition in Q. No. (13). If X(1) and X(2) are uncorrelated, then show that their distributions are multivariate normal of appropriate dimensions. Also, establish the same result even when X(1) and X(2) are correlated.                                                                      (7+13)


  1. (a) Present the ‘Orthogonal Factor Model’ and develop the ideas of ‘communality’ and ‘specific variance’.

(b) Explain the ‘Principal Factor’ Method of Factor Analysis. Bring out the approach to ‘Reduction of factors’ and ‘Decision on number of factors’.                                   (10+10)


  1. (a) Carry out the ‘single linkage’ process for clustering six items whose distance matrix is given below (Dendrogram not required):


(b) Derive the  expression for ‘Expected Cost of Misclassification’ in  the case  of  two

populations and obtain the Minimum ECM Rule. Discuss the special cases of equal prior

probabilities and equal misclassification costs.                                                        (10+10)


  1. (a) Derive the MLEs of the parameters of multivariate normal distribution.

(b) Establish the independence of the sample mean vector and sample var-cov matrix of a sample from multivariate normal distribution.                                                         (10+10)


Go To Main Page


Loyola College M.Sc. Statistics Nov 2012 Data Warehousing And Data Mining Question Paper PDF Download

LOYOLA COLLEGE (AUTONOMOUS), CHENNAI – 600 034

M.Sc. DEGREE EXAMINATION – STATISTICS

THIRD SEMESTER – NOVEMBER 2012

ST 3955 – DATA WAREHOUSING AND DATA MINING


Date : 08/11/2012            Dept. No.                                        Max. : 100 Marks

Time : 9:00 – 12:00


SECTION A

Answer all the questions                                                                               (2×10=20 Marks)


  1. Define ROC and AUC
  2. State any two uses of a Decision tree
  3. State the use of Kernel function in Support Vector Machine
  4. State any two uses of a Gains chart
  5. Explain any two application of text mining
  6. What are the components of a middle tier in a three tier architecture?
  7. How the connection is established between client tier and middle tier?
  8. How the connection is established between middle tier and database tier?
  9. What are the components of a decision support system?
  10. What are the components of a database tier?


SECTION B

Answer any FIVE questions                                                                                    (5×8=40 Marks)


  1. State the Applications of Data mining and the steps involved in a Data mining project
  2. Explain the steps involved in construction of a Classification tree
  3. Explain Bagging and Random Forest Method
  4. Explain the steps involved in AdaBoost M1 algorithm for Boosting model performance
  5. Explain Kth Nearest Neighbourhood Method of classification
  6. Explain the functionalities of all the components of a web server
  7. What are the steps involved in order to cash process
  8. What are the steps involved in a procedure procure to pay process


SECTION C

Answer any TWO questions                                                                        (2×20=40 Marks)

  1. (i) Explain Naive Bayes Classification method and the steps involved in construction of CHAID

(ii)Explain the methods of model validation

  1. (i) Explain Artificial Neural Network

(ii)Explain Support Vector Machine in detail

21.Explain the ETL process by explaining the different stages in data warehouse

  1. Explain the sql* loader process to transfer the data from the flat file to a table in a data base


Go To Main Page

Loyola College M.Sc. Statistics Nov 2012 Applied Regression Analysis Question Paper PDF Download

LOYOLA COLLEGE (AUTONOMOUS), CHENNAI – 600 034

M.Sc. DEGREE EXAMINATION – STATISTICS

FIRST SEMESTER – NOVEMBER 2012

ST 1821 – APPLIED REGRESSION ANALYSIS


Date : 05/11/2012            Dept. No.                                        Max. : 100 Marks

Time : 1:00 – 4:00


Part-A


Answer all the questions:                                                                                                                                                (10×2=20)


1) Define ‘residual’ in a regression model.

2) Explain adjusted R2.

3) What is the variance stabilizing transformation used when σ2 α E(Y) (1-E(Y))?

4) Mention any two sources of multi collinearity.

5) What is the need for standardized regression coefficients?

6) When the regression model is said to be hierarchical?

7) Explain the term auto correlation.

8) Explain AR (1) process.

9) Explain partial correlation coefficient.

10) Explain dummy variable trap.


Part-B


Answer any 5 questions:                                                                                                                                                  (5×8=40)


11) How will you verify the assumption of normality and constant variance in a linear regression model? Explain.

12) Consider the model

Y=β0 1 x12 x23 x3

It is decided to test H0: β13, β2=0

Write the reduced model and the data matrix relevant for the hypothesis, given the data matrix as


X=

13) Explain Studentized Residuals and externally studentized

Residuals.

14) Consider the following ANOVA used for fitting a linear

Regression model with 6 reggressors


ANOVA

Source df Sum of squares Mean square F
Regression 6 524.661
Residuals 1149
Total 29


  • Fill in the blanks (4)
  • What is the total number of observations? (1)
  • What conclusion do you draw about the over all fitness of the model? (2)


15) Explain generalized least squares.

16) What are the points to be considered in fitting a polynomial regression model?

17) Explain splines in detail.

18) Explain the random walk model in time series.


Part-C

Answer any 2 questions:                                                                                                                                                 (2×20=40)


19)a) An investigator has the following data


Y 3.2 5.1 4.5 2.4
X 5 9 6 4

Guide the investigator as to whether the model Y=β01X or Y1/201X is appropriate.

  1. b) Suppose theory suggested that annual income (Y) depended on sex(S), highest degree received (D), and years of experience (E).

The following data is obtained for 10 employees,

S No. Y E D S
1 13876 1 UG M
2 11608 2 PG F
3 18701 1 PG M
4 11283 2 H.Sc M
5 11767 2 UG F
6 20872 2 PG M
7 11772 4 UG F
8 10535 3 H.Sc F
9 12195 3 PG M
10 12313 2 H.Sc M

It is also decided to study the interaction effect of sex with education on Y. Write a suitable linear regression model, with the relevent data matrix.


20) Explain the various methods of diagnosing multicollinearity

and suggest the methods for removing it.


21) Given the following information for fitting a regression

model with 4 regressors. Use forward selection method

to find significant variables that enter at each iteration.

SST=2715.7635                                                   SSRes(x2, x3) =415.4

SSRes(x1) = 1265.6867                                       SSRes(x2, x4) =868.8

SSRes(x2) = 906.3363                                         SSRes(x3, x4) =175.7

SSRes(x3) = 1939.4                                              SSRes(x1, x2, x3) =48.1

SSRes(x4) =883.87                                               SSRes(x1, x2, x4) =47.9

SSRes(x1, x2) =57.9                                              SSRes(x1, x3, x4) =50.8

SSRes(x1, x3) =1227                                             SSRes(x2, x3, x4) =73.8

SSRes(x1, x4) =74.76                                           SSRes(x1, x2, x3, x4) =47.86


22) a) Explain the methods of studying autocorrelation in a

linear regression model.

  1. b) Explain the Box-Jenkins methodology of ARIMA

modelling.


Go To Main Page


Loyola College M.Sc. Statistics Nov 2012 Actuarial Statistics Question Paper PDF Download

LOYOLA COLLEGE (AUTONOMOUS), CHENNAI – 600 034

M.Sc. DEGREE EXAMINATION – STATISTICS

THIRD SEMESTER – NOVEMBER 2012

ST 3956 – ACTUARIAL STATISTICS


Date : 08/11/2012            Dept. No.                                        Max. : 100 Marks

Time : 9:00 – 12:00

Section – A


Answer all the questions:                                                                                                        ( 10 x 2 =20)


  1. Find the present value at rate of interest 7% p.a. of Rs.500/-payable in 4 years and months.
  2. What is discount?
  3. Define deferred annuity and deferment period.
  4. Write the formula for the present value of increasing annuity wherein the successive instalment from a geometric distribution.
  5. Define expectation of life and write and expression for ex.
  6. What is meant by Whole Life Assurance?
  7. Prove that A x:n = D x + n / Dx
  8. What is the benefit that is represent by a x : n – a x : n-1?
  9. What are the defects in the system in the system of charging natural premiums?
  10. Given that Ax =0.7115 and a x = 6.5 determine the rate of interest.


Section –B

Answer any five questions:                                                                                                     ( 5 x 8 =40)


  1. a) Find the effective rate p.a. corresponding to the nominal rate of 8% p.a. convertible quarterly.
  2. b) Find the nominal rate p.a. convertible quarterly corresponding to an effective rate of 8% p.a.
  3. A has taken a loan of Rs. 2000 at a rate of interest 4% p.a. payable half yearly. He repaid

Rs.400 after 2 years, Rs.600 after a further 2 years and cleared all outstanding dues at the

end of  7 years from the commencement of the transactions. What was the final payment

made by him?

  1. A has right to receive an amount of Rs.1000 at the end of 12 years from now. This right has been sold to B for a present value calculated at the rate of 8% p.a. The money thus received was invested by A in deposit account at 9% p.a. payable half yearly. After 8 years the account had to be closed and A then invested the amount available at 6% p.a. in another bank. How has A gained or lost in this transaction, as at the end 12 years?
  2. Derive an expression to find accumulated value of deferred annuity due.


  1. Find the following probabilities:
  • a life aged 35 will die between that ages 45 and 50
  • a life aged 35 will not die between that ages 45 and 50
  • a life aged 35 will die in the 10th year from now.
  • a life aged 35 will not die in the 10 year from now.


  1. Describe the relative advantages and disadvantages of the policy year method as against life year method and calendar year method.


  1. Using commutation functions based on LIC ( 1970 -1973) Ultimate mortality table at 6% interest. Calculate for a person aged 40;
  2. The present value of whole life assurance of Rs.10,000/-
  3. The present value of double endowment assurance of Rs.10,000

for 15 years term. Also calculate the present value of endowment assurance and the pure endowment each for Rs.10, 000 for 15 years term.

  1. Derive an expression for Increasing Temporary life annuity.


Section – C


Answer any two questions:                                                                                                   ( 2 x 20 = 40 )


  1. a) The cash purchase price of a bike is Rs. 10,000. A company however offers instalment plan where under an immediate payment of Rs. 2000 is to be made and a series of 5 equal half-yearly payments made thereafter, the first installment being payable at the end of 6 months. If the company wishes to realize a rate of interest of 12 % convertible half-yearly in the transaction, calculate the half-yearly instalment.


  1. b) A fund is to be set up out of which a payment of Rs.100 will be made to each person who in any year qualifies for membership of a certain procession. Assuming that 10 person will qualify at the end of one year from now, 15 at the end of 2 years, 20 at the end of 3 years, and so on till the number of qualifiers is 50 per annum. When it will remain constant? Find at 5% p.a. effective. What sum must be paid in to the fund now so that it sufficient to meet the outgo?


  1. a) A loan of 16,000/- is repayable by level instalment of principal and interest, payable  yearly in arrears over 15 years. The rate of interest is 8% p.a. for the first 6 years and 7% p.a. thereafter. Calculate the level yearly instalment and interest contained in the 1st, 2nd, 9th & 10th instalment.
  2. b) Of three person A, B and C, aged 40, 45 and 50 respectively, find the probability that at least one of them will not die between the ages 65 and 70.


  1. Explain in detail the stages in the construction of the life table.


  1. a) The following particulars are given:
x 25 26 27 28 29 30
lx 97380 97088 96794 96496 96194 95887
dx 292 294 298 302 307 313


Calculate ignoring interest, allowing interest @ 6 % and expenses:

  • The value of temporary assurance of Rs. 1000 for 2 years for a person aged 25.
  • The value of endowment assurance benefit of Rs. 1000 for 4 years to a person aged 25.


  1. b) Prove that  = n  ax


Go To Main Page


Loyola College M.Sc. Statistics Nov 2013 Data Warehousing And Data Mining Question Paper PDF Download

Go To Main Page

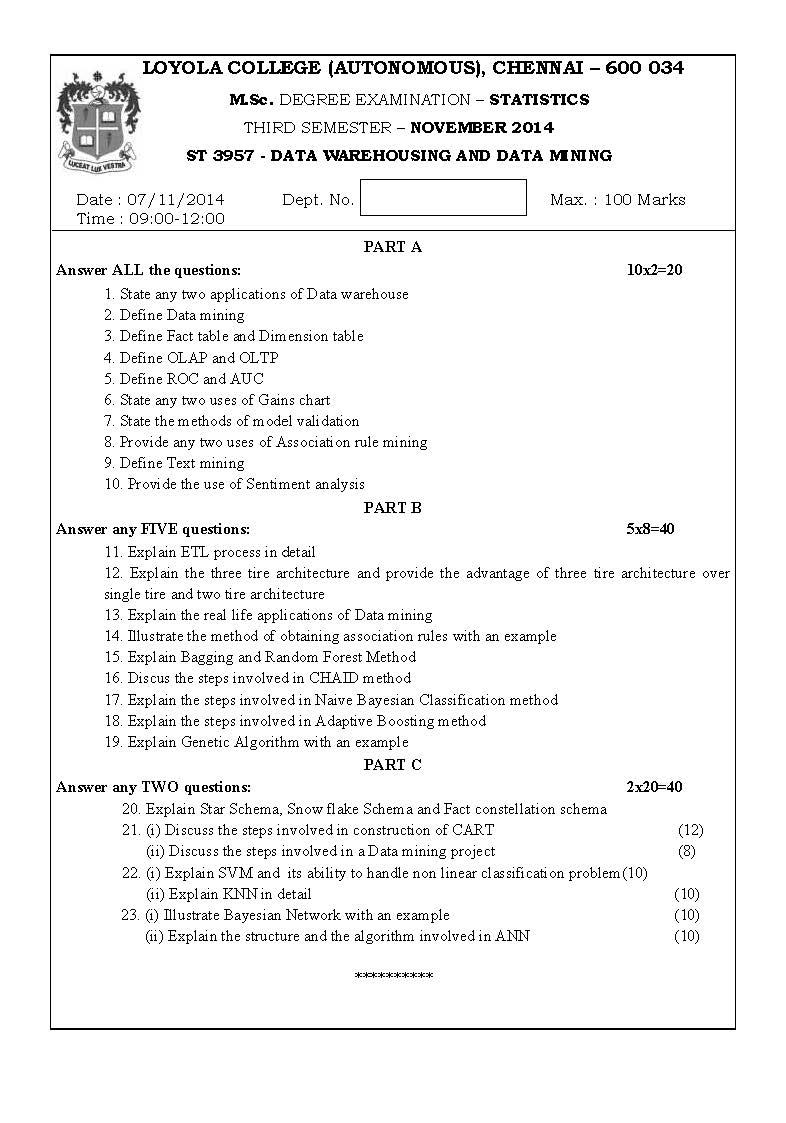
Loyola College M.Sc. Statistics Nov 2014 Data Warehousing And Data Mining Question Paper PDF Download

Go To Main Page

Loyola College M.Sc. Statistics Nov 2016 Categorical Data Analysis Question Paper PDF Download

Go To Main Page

© Copyright Entrance India - Engineering and Medical Entrance Exams in India | Website Maintained by Firewall Firm - IT Monteur