Loyola College B.A. Economics Nov 2006 Quantitative Tools For Economics Question Paper PDF Download

LOYOLA COLLEGE (AUTONOMOUS), CHENNAI – 600 034      B.A. DEGREE EXAMINATION – ECONOMICS

AN 06

THIRD SEMESTER – NOV 2006

         EC 3500 – QUANTITATIVE TOOLS FOR ECONOMICS

(Also equivalent to ECO 502)


Date & Time : 02-11-2006/9.00-12.00         Dept. No.                                                       Max. : 100 Marks

Part  – A

Answer any FIVE questions in about 75 words each.                  (5 x 4 = 20 marks)

  1. What do you mean by statistics?
  2. Write short notes on the following

(a) Histogram;       (b) frequency curve

  1. What are the main objectives of classification of data?
  2. What do you understand by primary data? In what way is it superior to secondary data?
  3. What are the objectives of averages?
  4. What is meant by correlation?
  5. What do you understand by the term regression?

Part – B

Answer any FOUR questions in about 300 words each.            (4 x 10 = 40 marks)

  1. Explain the functions of statistics.
  2. Draw the histogram of the frequency distribution of marks given below:

Marks(x):               10-15   15-20   20-30   30-40   40-50   50-57   75-100

Frequency(y):            4         12        20        18        14        25         10

  1. A candidate obtained the following percentages of marks in an examination: English 75; Statistics 60; Mathematics 59; Physics 55; Chemistry 63. Find the weighted mean if weights 2, 1, 3, 3 and 1 respectively are allocated to the subjects. Calculate the weighted mean and also the simple mean.
  2. Calculate the quartile deviations from the following data:
Income per week 25 26 27 28 29 30 31 32 33 34 35
No of persons 25 70 210 275 430 550 340 130 90 55 25
  1. From the following discrete data calculate Karl Pearson’s coefficient of skewness.

X:              6          12        18        24        30        36        42

f:                4          7          9          18        15        10        5

  1. Discuss the merits and demerits of arithmetic mean.
  2. Explain the method of least-squares.


Part – C

Answer any TWO questions in about 900 words each.              (2 x 20 = 40 marks)

  1. Explain the different methods of collecting primary data.
  2. Obtain Skewness and Kurtosis of coefficients from the following data.
X: 0-10 10-20 20-30 30-40 40-50 50-60 60-70
f: 4 8 11 15 11 7 4
  1. Obtain the two regression equations from the following data:
Hight(x): 61 68 68 64 65 70 63 62 64 67
Weight(Y): 112 123 130 115 110 125 100 113 116 126
  1. Analyze the uses and importance of index numbers.
Go To Main Page

Loyola College B.A. Economics April 2007 Quantitative Tools For Economics Question Paper PDF Download

LOYOLA COLLEGE (AUTONOMOUS), CHENNAI – 600 034

B.A.

RF 51

DEGREE EXAMINATION –ECONOMICS

THIRD SEMESTER – APRIL 2007

EC 3500QUANTITATIVE TOOLS FOR ECONOMICS


Date & Time: 21/04/2007 / 1:00 – 4:00              Dept. No.                                                      Max. : 100 Marks


PART – A


Answer any FIVE questions in about 75 words each.                      (5 x 4 = 20 Marks)


  1. Define statistics.
  2. Distinguish between primary data from secondary data.
  3. What are the objectives of classification and tabulation?
  4. What do you mean by the term average?
  5. What is harmonic mean?
  6. Define Karl Pearson’s coefficient of Skewness.
  7. What do you mean by index number?

PART – B


Answer any FOUR questions in about 250 words each.                  (4 x 10 = 40 Marks)


  1. Discuss the limitations of statistics.
  2. For the following data obtain the mean by deviation method.

X:   75        50        47        43        25

f:    3          1          1          3          2

  1. Locate the mode from the following data.

X:   10-20   20-30   30-40   40-50   50-60

f:        3          4         10        5          2

  1. For the following data calculate inter quartile deviation and its coefficient.

X: 10          30        50        70        90

f:    5          7          15        20        20

  1. Explain the types of correlation with economic illustration.
  2. Explain the difference between correlation and regression.
  3. Explain the major components of a time series.


PART – C


Answer any TWO questions in about 900 words each.                    (2 x 20 = 40 Marks)


  1. Briefly explain the method of data collection.
  2. For the following data calculate Bowley’s Coefficient of skewness:

X:   0-10     10-20   20-30   30-40   40-50

f:      4            7         10         8          5

  1. From the following data obtain the regression line Y on X and X on Y:

X:   1          2          3          4          5

Y:   6          10        14        18        22

  1. Analyse the method of constructing index numbers.

Go To Main Page

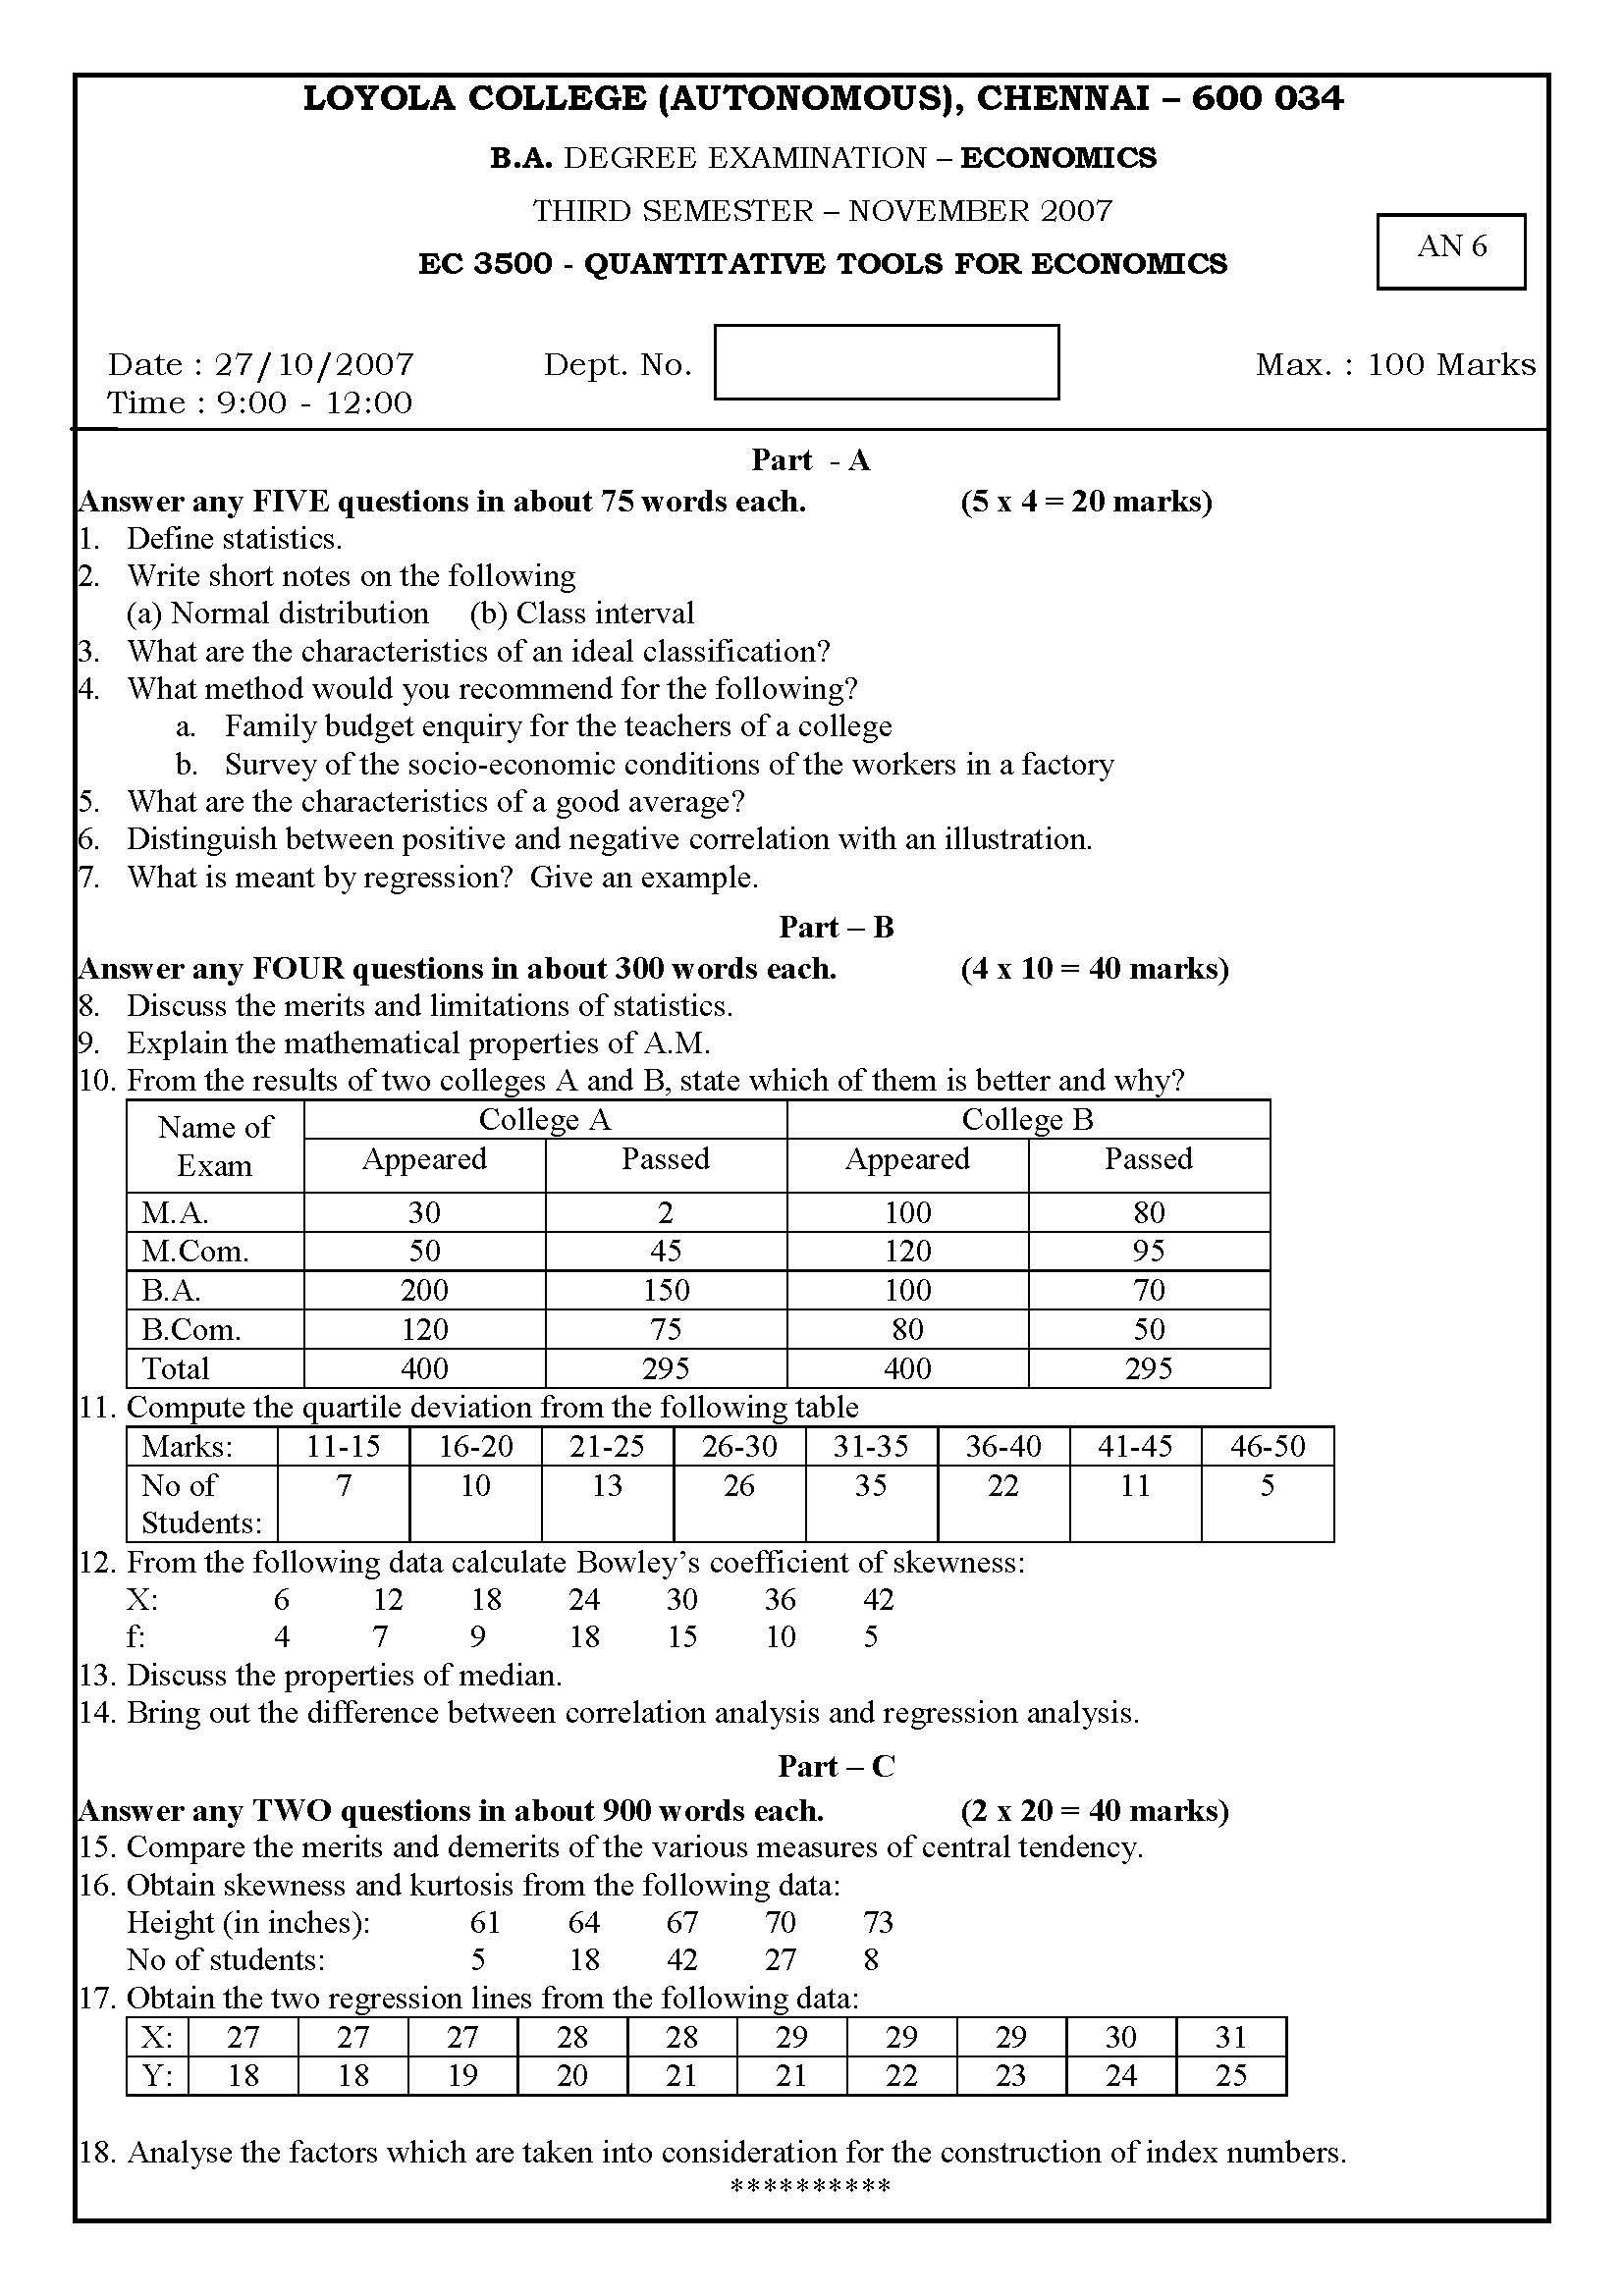
Loyola College B.A. Economics Nov 2007 Quantitative Tools For Economics Question Paper PDF Download

Go To Main Page

Loyola College B.A. Economics April 2008 Quantitative Tools For Economics Question Paper PDF Download

LOYOLA COLLEGE (AUTONOMOUS), CHENNAI – 600 034

BC 11


B.A. DEGREE EXAMINATION – ECONOMICS

THIRD SEMESTER – APRIL 2008

EC 3502 – QUANTITATIVE TOOLS FOR ECONOMICS


Date : 07/05/2008                Dept. No.                                       Max. : 100 Marks

Time : 1:00 – 4:00

PART – A


Answer any FIVE questions in about 75 words each:                      (5 x 4 = 20 marks)


  1. Define Statistics.
  2. Distinguish between a schedule and a Questionnaire.
  3. What are the different types of classification?
  4. State and explain two important properties of Arithmetic Mean.
  5. What is Bowley’s coefficient of skewness.
  6. What are the uses of Regression Analysis?
  7. What are the methods of construction of Index Numbers?


PART – B


Answer any FOUR questions in about 250 words each:                  (4 x 10 = 40 marks)       


  1. Discuss the various stages of Statistical Investigation.


  1. Calculate Median for the following data.
Marks <5 <10 <15 <20 <25 <30 <35 <40 <45
No. of

Students

29 224 465 582 634 644 650 653 655


  1. Calculate Mean Deviation form the Mean for the following data.
Size 2 4 6 8 10 12 14 16
Frequency 2 2 4 5 3 2 1 1


  1. From the following data calculate coefficient of variation and state which share value is more stable.
X 35 54 52 53 56 58 52 50 51 49
Y 108 107 105 105 106 107 104 103 104 101


  1. Briefly explain the Mathematical Properties of Standard Deviation.
  2. Explain the various components of Time series.
  3. Discuss the problems in the construction of Index Numbers.


PART – C


Answer any TWO questions in about 900 words each:                    (2 x 20 = 40 marks)


  1. Explain the methods of collecting data..


  1. Find the coefficient of the correlation for the following data
Cost 39 65 62 90 82 75 25 98 36 78
Sales 47 53 58 86 62 68 60 91 51 84


  1. Compute Laspeyres, Paasche, Fishers and Marshall-Edgeworth. Index Numbers from the following data.


  1. Fit a straight line trend for the following series. Estimate the value for 2008.
Year 2001 2002 2003 2004 2005 2006 2007
Production of Steel 60 72 75 65 80 85 95

Go To Main Page

Loyola College B.A. Economics April 2008 Quantitative Tools For Economics (2) Question Paper PDF Download

LOYOLA COLLEGE (AUTONOMOUS), CHENNAI – 600 034

BC 9


B.A. DEGREE EXAMINATION – ECONOMICS

THIRD SEMESTER – APRIL 2008

EC 3500 – QUANTITATIVE TOOLS FOR ECONOMICS


Date : 26/04/2008                Dept. No.                                       Max. : 100 Marks

Time : 1:00 – 4:00

PART – A

Answer any FIVE questions in about 75 words each:                      (5 x 4 = 20 marks)

  1. State and explain two important functions of statistics.
  2. What is a Pilot Survey?
  3. What is meant by Multiple bar diagram?
  4. Define Dispersion.
  5. What is Geometric Mean?
  6. What are the different methods of studying correlation?
  7. Define Time Series.

PART – B

Answer any FOUR questions in about 250 words each:                  (4 x 10 = 40 marks)

  1. Analyse the application of statistics in Economics and Business.
  2. Find the value of mode from the following data.
Marks 0-10 10-20 20-30 30-40 40-50 50-60 60-70 70-80 80-90 90-100
No. of

Students

3 5 7 10 12 15 12 6 2 8


  1. Calculate standard Deviation for the following distribution.
Age 20-25 25-30 30-35 35-40 40-45 45-50
No. of Persons 170 110 80 45 40 35


  1. Calculate Pearson’s coefficient of skew ness.
X 12.5 17.5 22.5 27.5 32.5 37.5 42.5 47.5
Y 28 42 54 108 129 61 45 33


  1. Explain the different types of correlation with examples.
  2. What are the qualities of a good questionnaire?
  3. Briefly explain the uses of Index Numbers.

PART – C

Answer any TWO questions in about 900 words each:                    (2 x 20 = 40 marks)


  1. Explain the different types of Diagrams.


  1. Calculate Arithmetic Mean, Median and Mode from the following data.
Variable 10-13 13-16 16-19 19-22 22-25 25-28 28-31 31-34 34-37 37-40
Frequency 8 15 27 51 75 54 36 18 9 7


  1. Analyse the methods of constructing Index Numbers.
  2. From the following data obtain the two regression equations and calculate correlation coefficient.
X 1 2 3 4 5 6 7 8 9
Y 9 8 10 12 11 13 14 16 15

Go To Main Page

Loyola College B.A. Economics Nov 2008 Quantitative Tools For Economics Question Paper PDF Download

LOYOLA COLLEGE (AUTONOMOUS), CHENNAI – 600 034

   B.A. DEGREE EXAMINATION – ECONOMICS

TA 09


THIRD SEMESTER – November 2008

EC 3502 – QUANTITATIVE TOOLS FOR ECONOMICS


Date : 06-11-08                     Dept. No.                                       Max. : 100 Marks

Time : 9:00 – 12:00

PART – A

Answer any FIVE questions in about 75 words each.                ( 5 x 4 = 20 marks )


  1. What are the functions of statistics ?
  2. Where do we use Pie diagram?
  3. Bring out the objectives of tabulation.
  4. Define coefficient of Skewness.
  5. What is the significance of Standard Error?
  6. Distinguish between Correlation and Regression.
  7. Give any four uses of Index numbers.


PART – B

Answer any FOUR questions in about 300 words each.             (  4 x 10  = 40 marks )


  1. Represent the following data by a simple bar diagram


State T.N ANDHRA KARNATAKA PUNJAP U.P KERALA
Production of Paddy in lakhs quintals                   38                      65                                52                        16                    10                        10


  1. Bring out the merits and demerits of different measures of Dispersion.


  1. Calculate the Quartile deviation for the following data


Wages in Rs./hr Below 35 35 – 37 38 – 40 41 – 43 Over 43
No. of wage earners 14 60 95 24 7


  1. Describe the various methods of collection of Primary Data.


  1. Calculate range , standard deviation and coefficient of variation in respect of the ‘SMS’ s given by 10 students per day.

50      55     57     49      54      61     64     59       58       56

  1. Calculate the coefficient of Rank correlation for the following data


X 53 98 95 81 75 61 59 55
Y 47 25 32 37 30 40 39 45


  1. How do you forecast the Indian GDP for the year 2010 ?


PART – C


Answer any TWO questions in about 900 words each.             (  2 x 20  = 40 marks )


  1. Explain the importance of statistics in economic analysis and business decision making.
  2. Calculate the Mean , Median and mode for the given data


Class 66 – 67 67 – 68 68 – 69 69 – 70 70 – 71 71 – 72
Frequency 15 24 40 20 14 11


  1. Estimate the regression equations  Yi   =   a  +  b Xi   and  Xi   =   c  +  d Yi    and also find out the value of  Y when  X =  30 from the following data


Yi 43 46 49 41 36 32 31 30 33 39
Xi 25 28 35 32 31 36 29 38 34 32


  1. Calculate fisher’s ideal index number and prove that it satisfy Time reversal and Factor reversal

test.


(  QUANTITY )                                     ( PRICE )

Commodity 2000 -2001 2007 -2008 2000 – 2001 2007 – 2008
Food 250 300 150 130
Rent 100 120 120 200
Cloth 20 30 600 1000
fuel 10 22 200 300

Go To Main Page

Loyola College B.A. Economics Nov 2008 Quantitative Tools For Economics (2) Question Paper PDF Download

LOYOLA COLLEGE (AUTONOMOUS), CHENNAI – 600 034

TA 07


   B.A. DEGREE EXAMINATION – ECONOMICS

THIRD SEMESTER – November 2008

EC 3500 – QUANTITATIVE TOOLS FOR ECONOMICS


Date : 06-11-08                     Dept. No.                                       Max. : 100 Marks

Time : 9:00 – 12:00


PART – A

Answer any FIVE questions in about 75 words each.                ( 5 x 4 = 20 marks )


  1. What is classification ?
  2. Define  scatter diagram?
  3. Distinguish between primary data and secondary data.
  4. Define coefficient of variation .
  5. Where do we use the mode ?
  6. What is the principle of ordinary least squares ?.
  7. Give any four time series data used in economics.


PART – B

Answer any FOUR questions in about 300 words each.             (  4 x 10  = 40 marks )


  1. Represent the following data by a simple Pie diagram


State T.N ANDHRA KARNATAKA PUNJAP U.P KERALA
Number of projects                   38                      65                                52                        16                    10                        10


  1. The daily income of 10 workers at Koyambedu market are given below


worker 1 2 3 4 5 6 7 8 9 10
Income in Rs. 85 70 10 75 500 8 42 250 40 36

Calculate the Harmonic mean  daily income of workers in the market.


  1. Mean and standard deviations of the two distributions 100 and 150 items are 50 , 5 and 40 , 6

respectively . Find the mean and standard deviation of all the 250 items taken together.


  1. What are the components of a time series trend?


  1. Calculate the coefficient of rank correlation between the marks .
economics 85 60 73 40 90
statistics 93 75 65 50 80


  1. Explain the difference between correlation and regression analysis.


  1. Estimate the trend equation by OLS for the following data


year 2001 2002 2003 2004 2005 2006 2007
sales 180 190 192 183 194 199 192


PART – C


Answer any TWO questions in about 900 words each.             (  2 x 20  = 40 marks )


15 . Explain the importance of statistics in economic analysis and business decision making.

  1. Calculate the Karl Pearson’s coefficient of skew ness


Class 0 – 10 10 – 20 20 – 30  30 –40 40 – 50 50 – 60 60 – 70 70 – 80
Frequency 10 40 20 0 10 40 16 14


  1. Estimate the regression equations  Yi   =   a  +  b Xi   and  Xi   =   c  +  d Yi    where Yi = Age of husband   and Xi = Age of wife


Yi 18 19 20 21 22 23 24 25 26 27
Xi 17 17 18 18 19 19 19 20 21 22


  1. Calculate fisher’s ideal index number and prove that it satisfy Time reversal and Factor reversal

test.


(  QUANTITY )                                     ( PRICE )

Commodity 2000 -2001 2007 -2008 2000 – 2001 2007 – 2008
A 12 15 10 12
B 15 20 7 5
C 24 20 5 9
D 5 5 16 14

Go To Main Page

Loyola College B.A. Economics Nov 2010 Quantitative Tools For Economics Question Paper PDF Download

LOYOLA COLLEGE (AUTONOMOUS), CHENNAI – 600 034

   B.A. DEGREE EXAMINATION – ECONOMICS

THIRD SEMESTER – NOVEMBER 2010

EC 3502/EC 3500 – QUANTITATIVE TOOLS FOR ECONOMICS


Date : 02-11-10                     Dept. No.                                                     Max. : 100 Marks

Time : 9:00 – 12:00


PART – A


Answer any FIVE questions in about 75 words each.                                                        (5 x 4 = 20 marks)


  1. Define ‘Statistics’.
  2. Distinguish between ‘census’ and ‘sample’.
  3. What are the objectives of classification?.
  4. Give one situation each where we use Mean, Median and Mode.
  5. What is the difference between skewness and kurtosis?
  6. What are the different types of correlation?
  7. Bring out the limitations of Index Numbers.


PART – B


Answer any FOUR questions in about 300 words each.                                                  (4 x 10 = 40 marks )


  1. Exports and Imports of a country from 2007-08 to 2009 -10 are given below.

Show the data with the help of multiple bar diagram.


Year EXPORT( in crores of Rs.) IMPORT ( in crores of Rs.)
2006 -07 800 1000
2007 -08 750 1500
2008 – 09 1000 2000
2009 – 10 1500 2000


  1. Explain in detail the functions of Statistics.


  1. Calculate the Standard  deviation for the following data:


Age in years 20-25 25-30 30-35 35-40 40-45 45-50 50-55
No. of employees 170 110 80 45 40 30 25


  1. Compare and contrast correlation analysis with regression analysis.


  1. If Mean = 40 , standard deviation = 10 and Karl Pearson’s coefficient of skewness = 0.5 . Find the Median and Mode.


  1. Calculate the coefficient of Rank correlation for the following data:


X 80 78 75 75 68 67 60 59
Y 12 13 14 14 14 16 15 17


  1. Explain the various components of Time series?

PART – C


Answer any TWO questions in about 900 words each.                                                     (2 x 20 = 40 marks)


  1. Explain different methods of Tabulation, Diagrams and graphic representation of Data.


  1. The following data refer to profits in Rs. Per month, of 100 companies:


PROFIT 6000 -7000 7000 -8000 8000 -9000 9000 -10000 10000 -11000 11000 -12000
No. of companies 11 15 19 25 20 10


Determine Bowley’s coefficient of skewness and interpret its value.


  1. Estimate the regression equation Yi   =   a + b Xi and also the correlation co efficient between

the two given variables.


Yi 61 72 73 73 63 84 80 66 76 74 72
Xi 40 52 59 53 61 58 56 42 58 50 50


  1. Calculate Fisher’s ideal index number and prove that it satisfy Time reversal and Factor reversal test.


(QUANTITY)                                       (PRICE)

Commodity 2000 -2001 2009 -2010 2000 – 2001 2009 – 2010
A 10 12 5 6
B 12 8 7 10
C 8 8 10 12
D 5 6 4 5
E 7 8 8 8

Go To Main Page

Loyola College B.A. Economics April 2011 Quantitative Tools For Economics Question Paper PDF Download

LOYOLA COLLEGE (AUTONOMOUS), CHENNAI – 600 034

B.A. DEGREE EXAMINATION – ECONOMICS

THIRD SEMESTER – APRIL 2011

EC 3502/EC 3500 – QUANTITATIVE TOOLS FOR ECONOMICS


Date : 25-04-2011              Dept. No.                                                  Max. : 100 Marks

Time : 1:00 – 4:00


PART – A


Answer any FIVE of the following in about 75 words each.                                      (5 x 4 = 20 marks)


  1. Bring out the limitations of statistics.
  2. State the characteristics of statistics.
  3. Bring out the advantages of Census type enquiry.
  4. What is meant by classification of data?
  5. What are the properties of a good measure of dispersion?
  6. What is an Index number?
  7. Briefly explain simple regression and multiple regression.


PART – B


Answer any FOUR questions in about 300 words each.                              (4×10 = 40 marks)


  1. Discuss the importance of statistics


  1. What are the various types of diagrams? Explain each with suitable example.


  1. Calculate the mean, median and mode from the following frequency distribution

Marks                       5     10     15    20     25     30    35    40     45    50

No. of students         20   43    75     76     72     45    39     9        8      6


  1. What are the various methods of measuring skewness?


  1. Explain how correlation could be studied with the help of scatter diagram method.


  1. Write short notes on: a) Method of moving averages, b) Method of least squares.


  1. Calculate the 3 year moving average of the sales figures given below and draw the trend.


Year  1994  1995  1996  1997   1998  1999   2000    01    02   03    04     05     06     07     08


Sales   15       21     30      36        42      46      50      56     63   70    74     82     90     95    102


PART – C


Answer any TWO of the following in about 900 words each.                                  (2×20 = 40 marks)


  1. What is data? Distinguish between primary data and secondary data giving various methods of collecting primary data.


  1. In the following data distribution of population in a city, those who have respiratory problems are given. Find out if there is any relationship between age and the illness.


Age           0 – 10   10 – 20   20 – 30  30 – 40  40 – 50   50 – 60   60 – 70  70 – 80


No.of                                                                                                                                                    persons       55           67          100         111       150         200         300        300

with illness

per lakh pop.


  1. Using the data given calculate price index numbers for the year 2008 by
  2. a) Laspeyer’s method b) Passche method c)  Fisher’s index with 1999 as base.


Commodity                                      Price                                      Quantity

1999               2008               1999               2008

(Rs.)               (Rs.)                (000kg)        (000 kg)


Rice                                          9.3                   4.5                   100                 90

Wheat                                       6.4                   3.7                    11                   10


Pulses                                      5.1                   2.7                      5        2


  1. For the following data obtain the two regression equations.


X      6       2      10       4        8


Y      9     11        5       8        7.

Go To Main Page

Loyola College B.A. Economics April 2012 Quantitative Tools For Economics Question Paper PDF Download

LOYOLA COLLEGE (AUTONOMOUS), CHENNAI – 600 034

B.A. DEGREE EXAMINATION – ECONOMICS

THIRD SEMESTER – APRIL 2012

EC 3502/EC 3500 – QUANTITATIVE TOOLS FOR ECONOMICS


Date : 26-04-2012              Dept. No.                                        Max. : 100 Marks

Time : 9:00 – 12:00


PART – A


Answer any FIVE questions in about 75 words each:                                            (5 x 4 = 20 marks)


  1. Bring out the limitations of Statistics.
  2. What are the uses of Index Numbers?
  3. What are the requisites of a good average?
  4. Discuss the different methods of classification.
  5. Calculate Range and its coefficient for the following:


Marks No. of Students
10 – 20  8
20 – 30 10
30 – 40 12
40 – 50  8
50 – 60  4


  1. Calculate Harmonic mean for the following:


X: 5 7 10 13 15 20 25 28


  1. What are the different measures of Dispersion?


PART – B


Answer any FOUR questions in about 300 words each:                                           (4 x 10 = 40 marks)


  1. Explain the components of a Time Series.


  1. Calculate mode for the following:


Marks No. of Students
0 – 10 3
10 – 20 5
20 – 30 7
30 – 40 10
40 – 50 12
50 – 60 15
60 – 70 12
70 – 80 6
80 – 90 2
90 – 100 8


  1. What are the difficulties in the construction of Index Numbers?


  1. Find the coefficient of correlation for the following:


X: 39 65 62 90 82 75 25 98 36 78
Y: 47 53 58 86 62 68 60 91 51 84


  1. Draw a multiple bar diagram from the following:


Year Sales (in `1000) Gross Profit (in `1000) Net Profit (in `1000)
2007 120 40 20
2008 135 45 30
2009 140 55 35
2010 150 60 40


  1. From the following data obtain the regression equation of Y on X.


X: 6 2 10 4 8
Y: 9 11 5 8 7


  1. What are the functions of Statistics?

PART – C


Answer any TWO in about 900 words each:                                                         (2 x 20 = 40 marks)


  1. Explain in detail the different methods of Primary data collection.


  1. Calculate Quartile Deviation and its coefficient from the following:


X
20
28
40
12
30
15
50


  1. Construct Index Numbers of price by applying:


  1. Lespeyres method (ii) Paasche method

iii)        Bowley method                      (iv) Fishers ideal method


Commodity 2006 2007
Price Quantity Price Quantity
A 2 8 4 6
B 5 10 6 5
C 4 14 5 10
D 2 19 2 13


  1. Fit a straight line trend for the following data by the method of Least Squares:


Years Production (in m.tonnes)
2003 80
2004 90
2005 92
2006 83
2007 94
2008 99
2009 92

Go To Main Page

Loyola College B.A. Economics Nov 2012 Quantitative Tools For Economics Question Paper PDF Download

LOYOLA COLLEGE (AUTONOMOUS), CHENNAI – 600 034

B.A. DEGREE EXAMINATION – ECONOMICS

THIRD SEMESTER – NOVEMBER 2012

EC 3502/EC 3500 – QUANTITATIVE TOOLS FOR ECONOMICS


Date : 05/11/2012             Dept. No.                                       Max. : 100 Marks

Time : 9:00 – 12:00


PART – A


Answer any FIVE questions in about 75 words each:                                                  (5 x 4 = 20 marks )


  1. What are the uses of statistics?
  2. Where do we use Pie diagram?
  3. Bring out the objectives of classification.
  4. Define ‘coefficient of Range’.
  5. What is the significance of Ordinary Least Square Technique?
  6. Distinguish between Correlation and Regression.
  7. What are the components of a Time series?


PART – B


Answer any FOUR questions in about 300 words each:                                           ( 4 x 10  = 40 marks )


  1. Represent the following data by a pie diagram


Items Food Education Rent Health Entertainment communication
Expenditure per month in thousand rupees 16 8 6 3 5 2


  1. What are the merits and demerits of different measures of Dispersion?


  1. Calculate the Harmonic mean of the daily  income of 10 families:


Family 1 2 3 4 5 6 7 8 9 10
Income in Rs. 85 70 10 75 500 8 42 250 40 36


  1. The arithmetic mean and standard deviation of a series of 20 items were calculated by a student as 20 cm and 3 cm respectively. But while calculating them an item 13 was misread as 30. Find the correct standard deviation.


  1. A random sample of 5 students from the second B.A. Economics has been selected and their marks scored in micro and macro economics are found to be


Student 1 2 3 4 5
Micro economics 85 60 40 90 73
Macro economics 93 75 50 80 65


Calculate the coefficient of Rank correlation and interpret.


  1. From the following data of the rainfall and production of Rice , find the most likely production corresponding to the rainfall of 40’’ .


Rainfall ( inches) Production in quintals
Mean 35 50
Standard deviation 5 8
Co efficient of correlation 0.80


  1. Assume that you have time series data of GDP from the year 1971 to 2010.

How do you forecast the Indian GDP for the year 2015?


PART – C


Answer any TWO questions in about 900 words each:                                            ( 2 x 20  = 40 marks )


  1. How does the statistical analysis help in understanding Economics?
  2. From the following data of weight of 122 persons determine the  Mean , Median and Modal weights.
Weights in lbs 100-110 110-120 120-130 130-140 140-150 150-160 160-170 170-180
Number of persons 4 6 20 32 33 17 8 2


  1. Estimate the consumption function Yi  =  a + b Xi   from the following data:


consumption in hundreds of rupees Yi 30 60 40 50 60 30 70 50 60
Income in hundreds of rupees Xi 50 60 50 60 80 50 80 40 70


  1. Estimate Fisher’s ideal index number and prove that it satisfy Time reversal and Factor

reversal test.


(  QUANTITY )                                     ( PRICE )

Commodity 2000 -2001 2011 -2012 2000 – 2001 2011 – 2012
A 8 6 2 4
B 10 5 5 6
C 14 10 4 5
D 19 13 2 2

Go To Main Page

© Copyright Entrance India - Engineering and Medical Entrance Exams in India | Website Maintained by Firewall Firm - IT Monteur